IMPLICATIONS
OF POTENTIAL WEAPON DEVELOPMENTS
FOR STRATEGIC BOMBING AND AIR
DEFENSE
A Preliminary Study
C. J. Hitch and W. M. Capron
RM-868
10 July 1952
- - - - - - - - - - - - - - - - - - - - - - - - - - - - - - - - - - - - - - - - - - - -
IMPLICATION
OF POTENTIAL WEAPON DEVELOPMENTS
FOR STRATEGIC BOMBING AND AIR
DEFENSE
A Preliminary Study
TABLE OF CONTENTS
PREFACE
SUMMARY
I. IMPLICATIONS FOR U.S. STRATEGIC BOMBING CAPABILITY
Effect on Coverage of Individual Targets
Effect on Target Selection and Expected Damage
Selected Industrial Targets and Industrial Concentrations
Urban Destruction and Mortalities
II. IMPLICATIONS FOR SOVIET CAPABILITIES FOR STRATEGIC BOMBING OF U.S.
Selected Industrial Targets and Industrial Concentrations
Urban Destruction and Mortalities
Effect of CEP on Mortality Estimates
III. COMPARISON OF THE IMPLICATIONS OF NEW WEAPONS FOR U. S. AND S.U.
IV. IMPLICATIONS FOR DEFENSE
Active Air Defense
Dispersal
Stockpiling War Reserves
Comparison of Various Measures
Reducing the Vulnerability of Our Population
Vulnerability of our Military Force in Being
Implications for U. S. Air Defense: Summary
Soviet Defenses
APPENDIX
All classified references have been deleted.
- - - - - - - - - - - - - - - - - - - - - - - - - - - - - - - - - - - - - - - - - - - -
The work described in this Research Memorandum was under the direction of C. J. Hitch, Chief of the Economics Division of RAND. The Memorandum was prepared Jointly by C. J. Hitch and W.M. Capron.
In this paper an attempt has been made to look at certain of the implications of the potential development of thermonuclear bombs in the next few years. This has been done in the broadest and most general terms because time and lack of the necessary data and conceptual tools precluded exhaustive quantitative analysis.
Many of the numerical estimates included in this paper are approximations and are not intended to represent precise figures. In some cases this results from inadequacies of the basic data, in others from our decision to use methods that could only give approximate answers since this was all that our purpose required. Only by the use of quantitative estimates did we feel it possible to sharpen the implications of the new weapon and to compare thermonuclear bombs with current A-weapons.
We thank the Department of the Army and the Stanford Research Institute for permission to use basic population data, derived from Census figures primarily for a study to be issued by the Operations Research Office, Johns Hopkins University (operating under contract with the Department of the Army).
We are indebted to H. Hanunian and E. Lee of RAND for assembling the data and undertaking the computations.
This paper examines some of the implications thermonuclear weapons ("H-Bombs") will have for U. S. strategic bombing and national defense.
For the U.S. strategic bombing mission against the Soviet Union, the assumed weapon greatly increases the certainty with which we can deal a crippling blow to Soviet industrial capacity and economic war potential. If the target list includes large percentages of the capacity of key industries such as steel, aluminum, petroleum and military equipment, a very small number of H-bombs will completely destroy the indicated targets. CEP becomes inconsequential and delivery costs to accomplish any given level of damage are greatly reduced.
However, the major conclusion of our consideration of the relation between the H-bomb and various possible target systems, is that no matter how the exact DGZ's are selected, this weapon is inevitably an area weapon.
Whether the target system consists of selected industrial plants, industrial concentrations, or large urban areas, the effect will be much the same: casualties running to many millions, widespread damage to industry, whole cities virtually leveled, so that even those industrial plants on the outskirts of attacked cities which survive complete destruction will be inoperable because of loss of labor force, utilities, etc.
Soviet possession of the H-bomb will be of great significance because it will provide a capability of striking a major strategic blow against the continental U.S. The extent of damage they can do with A-bombs, while extremely serious, is probably not of the same order as our ability to retaliate with A-bombs.
Two factors limit the Soviet capability of atomic attack. Both would be offset by their possession of the H-bomb. First, our over—all economic capacity is such larger than theirs, which gives us a much larger "cushion" of nonessential capacity (from a war materiel point of view) in most industries. Second, their delivery problem is greater and their capability less veil-developed than ours. However, even a relatively small number of H-bombs (50 – 100) delivered over the target areas could deprive us of major propor— tions of our capacity in important industries, destroy a large number of our industrial concentrations, level large sections of our important urban areas, and cause fantastically high casualties.
The conclusion is, then, that the comparative advantage of H-bomb possession lies with the Soviet Union, assuming both nations develop this weapon. More important, strategic air power armed with this weapon can do damage and cause casualties on a scale which is difficult to comprehend.
The over—all implication of this weapon for air defense is clear: our vulnerability is much greater than we have thought and there is now a real urgency for us to do what we can to meet the potential threat. The best defense, of course, is to prevent the H-bomb from being used against us. Even if war cannot be avoided, our possession of a strong SAC capable of delivering a retaliatory attack with H-bombs, should they be used against us, is, in our view, our most essential defense weapon, since such a force may effectively deter the Soviets from employing this bomb against us. And if they should disregard our capability, then a retaliatory force will be urgently required if we are not to lose the war. The protection of SAC thus becomes of central importance.
We consider several defense possibilities and conclude that:
1) Active air defense can and should be strengthened, but we cannot expect all attacking planes to be stopped — we must expect serious damage.
2) General dispersal of our industries and cities is not feasible and probably would not give us a significant reduction in our vulnerability. Selective dispersal of certain facilities is undoubtedly called for.
3) A program of stockpiling a war reserve so that our military force in being at the time of attack could be sustained largely from stocks for a period of a year or two appears to us to deserve serious consideration. This is especially true of our strategic air power. Since we probably cannot prevent major loss of industrial capacity, the United States cannot expect to follow her traditional policy of mobilizing after the war begins.
4) Measures to reduce the vulnerability of our population are urgently required. The construction of shelters to reduce casualties in our urban centers seems fully warranted providing a shelter can be designed at reasonable cost to give protection from the effects of thermonuclear weapons. In addition, consideration should be given to planning evacuation, and planning for the post-attack care of survivors, including the provision of shelter and food.
5) Our military force in being must be protected by dispersal, protective construction, etc.
The Soviets face an equally serious defense problem and it will take a proportionately larger share of their resources to accomplish comparable levels of defense.
- - - - - - - - - - - - - - - - - - - - - - - - - - - - - - - - - - - - - - - - - - - -
IMPLICATIONS
OF POTENTIAL WEAPON DEVELOPMENTS
FOR STRATEGIC BOMBING AND AIR
DEFENSE
A Preliminary Study
C. J. Hitch and W. M. Capron
We define "strategic" bombing to mean attack on an enemy's industrial mobilization potential and on military targets (for example, counter-air) requiring deep penetration. The development of moderately cheap and light H-bombs would enormously strengthen the strategic air offensive in relation to air defense. We will first consider the implications of this development for our strategic bombing of the USSR.
The major implication of this weapon for the U.S. strategic air mission is that any uncertainty as to our ability to destroy the industrial base of Soviet war potential is removed and the cost to us of causing any desired level of damage is greatly reduced. We think that with the conventional atomic weapons now stockpiled we can strike a crippling blow at the Soviet economy, provided we have an adequate force to deliver these weapons. We think we can destroy, or at least damage severely, Soviet air bases and other military installations requiring deep penetration into the Soviet Union with the same weapon. But there are doubts about this capability which are widely held and which are not entirely unreasonable. These doubts are based on the related consideration of target vulnerability and bombing accuracy. Are we underestimating, as many did in World War II, combat degradation of bombing accuracy? Are we overestimating the physical vulnerability of SAC targets?
The answers to these questions are critical to the success of the SAC operation. If pessimistic assumptions are made as to accuracy and vulnerability — that is, if we assume a large CEP and relatively "tough" targets, then to accomplish destruction of the order generally conceived to be necessary, a very large number of stockpile—type bombs must be delivered by SAC- If, in addition, we credit the Soviet with a high level of air defense, this means a very large SAC delivery capability will be required.
Effect on Coverage of Individual Targets
The increase in certainty of accomplishing the SAC mission, which is promised by the development of the H-bomb, is illustrated by Table I which contrasts the probability of covering point targets of different vulnerabilities with 20 and 150-KT A-bombs on the one hand, and 1-MT, 5-MT, and 25-KT H-bombs on the other. This comparison is made assuming good bombing accuracy (defined as CEP = 3,000 ft.), average accuracy (CEP = 5,500 ft.) and poor bombing accuracy (CEP = 8,000 ft.).
|
TABLE
I |
||||||
|
CEP (feet) |
TARGET |
A-BOMB |
H-BOMB |
|||
|
20-KT |
150-KT |
1-MT |
5-MT |
25-MT |
||
|
3,000 |
Hard |
0.10 |
0.52 |
077 |
0.99 |
1.00 |
|
Soft |
0.23 |
0.63 |
0.97 |
1.00 |
1.00 |
|
|
5,500 |
Hard |
0.03 |
0.11 |
0.35 |
0.72 |
0.98 |
|
Soft |
0.07 |
0.26 |
0.65 |
0.96 |
1.00 |
|
|
6,000 |
Hard |
0.02 |
0.05 |
0.19 |
0.45 |
0.83 |
|
Soft |
0.04 |
0.13 |
0.39 |
0.79 |
0.99 |
|
|
* – Table 1 translates the above into the number of bombs required to destroy a point target with certainty |
||||||
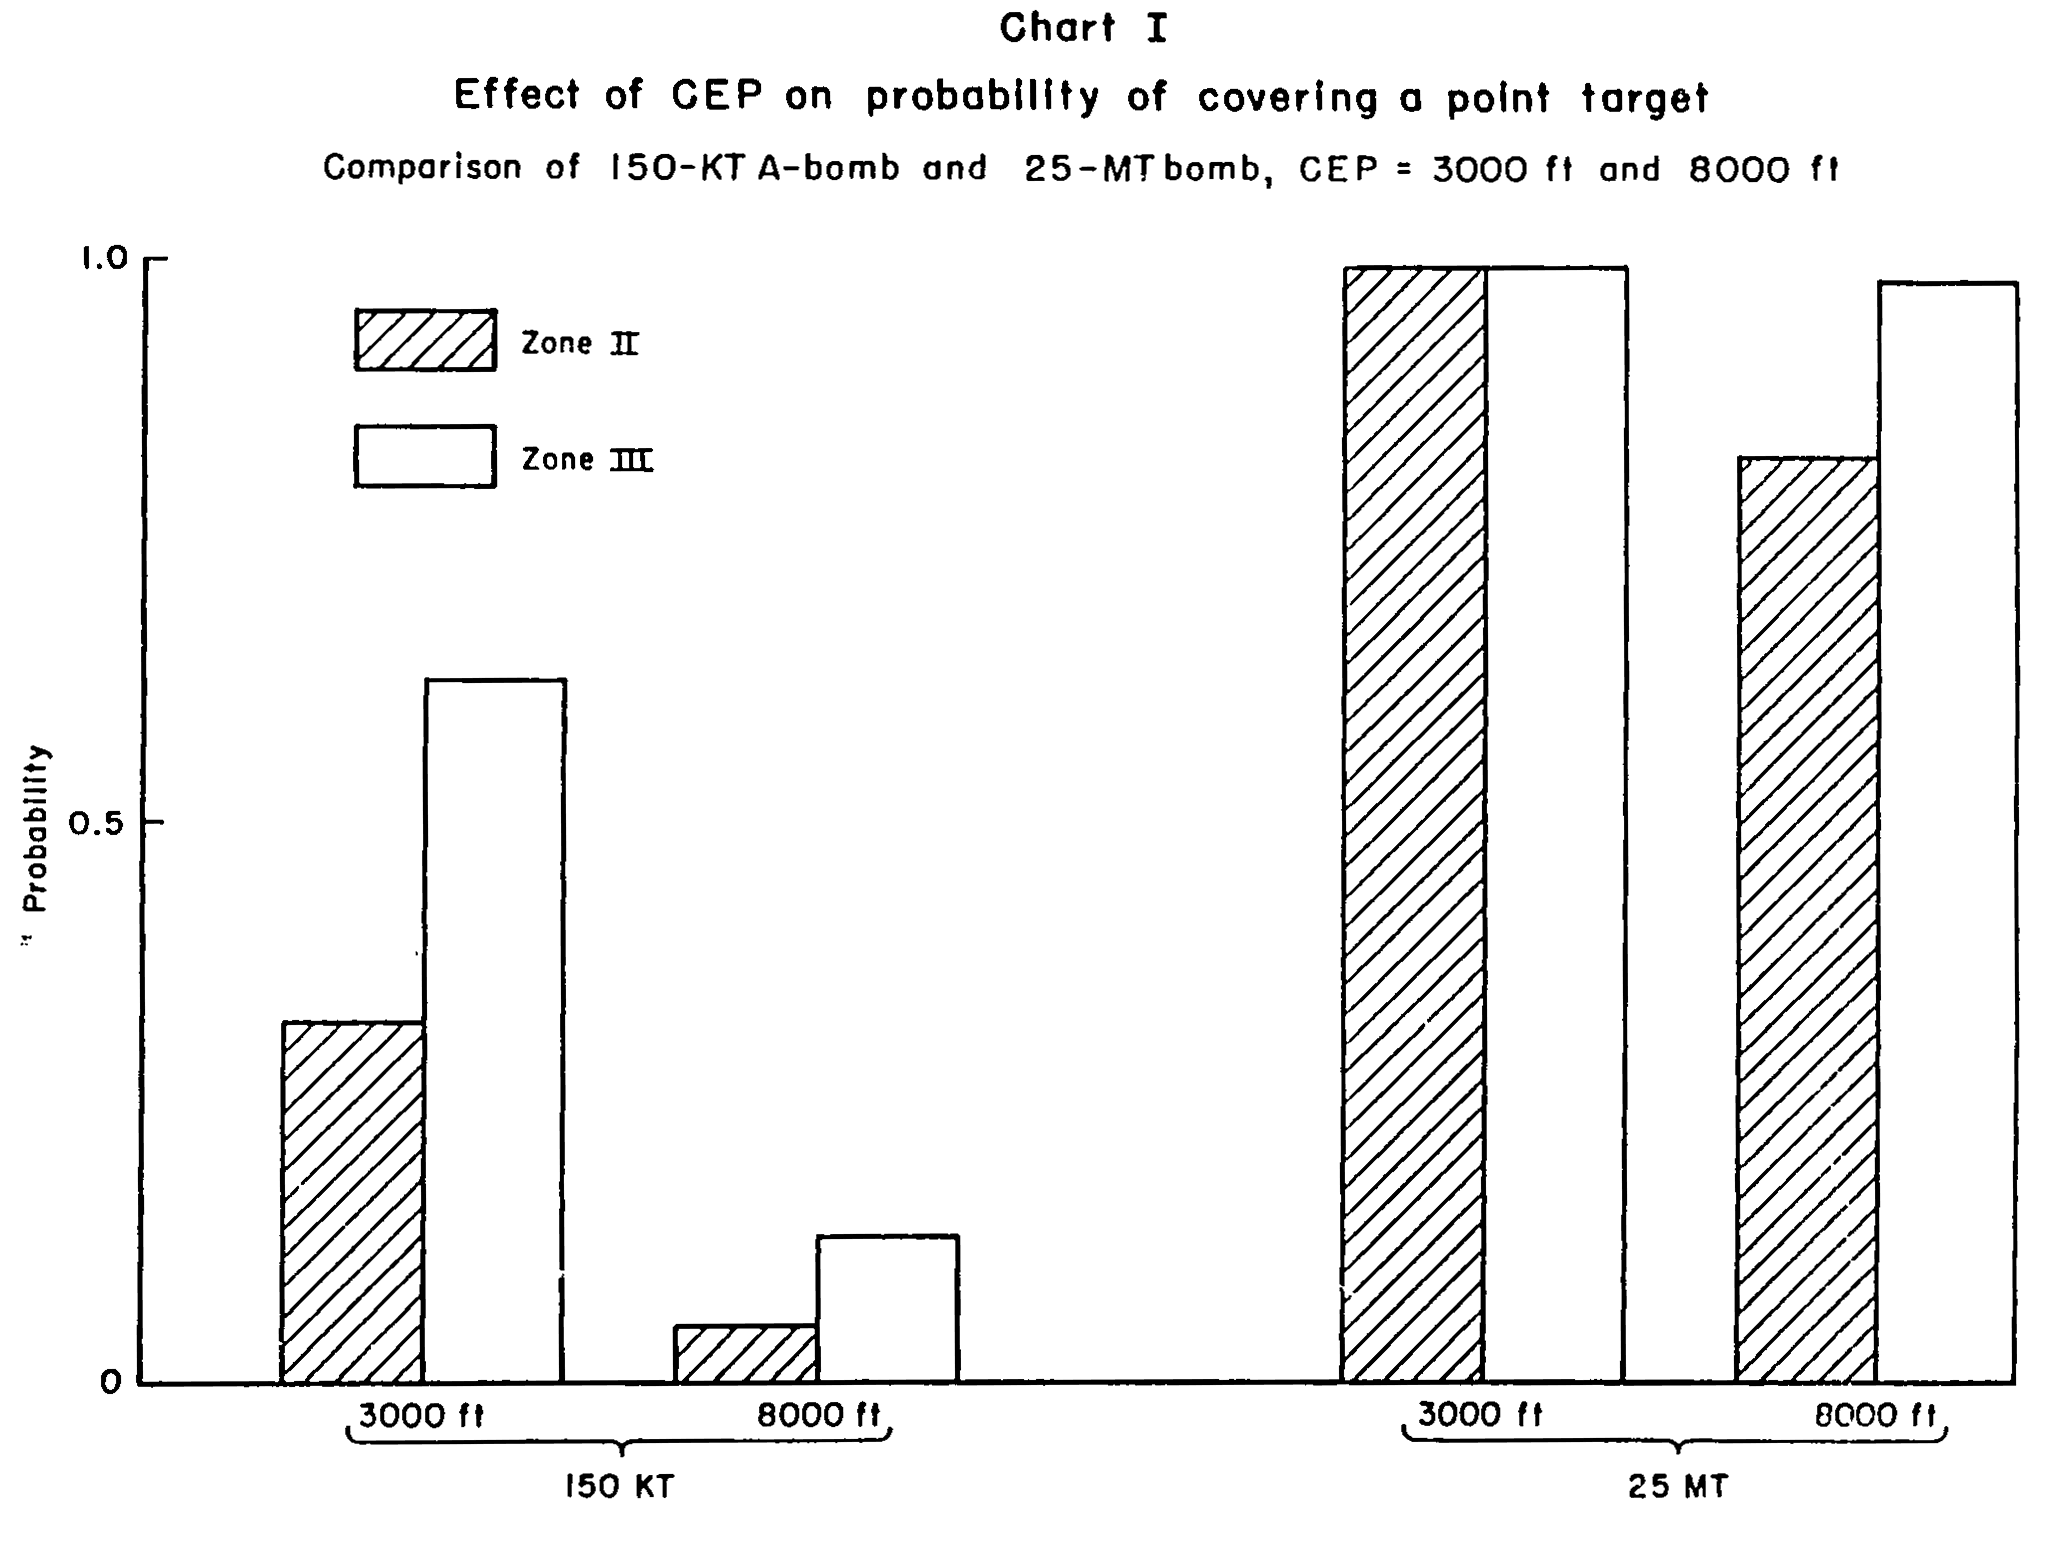
Chart I highlights the contrast by comparing the 150-KT and 25-MT weapons for the extreme CEP assumptions. In the most favorable case, where accuracy is good and the target "soft," (*) the probability is slightly above 0.6 that a 150-KT bomb will destroy the target.
[ * - The overpressure requirements assumed for destruction of "soft" and "hard" targets are high, in that they assume complete destruction of the two types of targets. A "soft" target is defined as one requiring 20 p.s.i. for destruction (Zone III), a "hard" target 50 p.s.i. (Zone II).]
The important gain in this case which would accrue to us if we used the H-bomb would occur when the target in question is located in a city with multiple targets in the area. The much larger area covered with destructive effect by the H-bomb would mean not only certainty of destroying the target in question but a tremendous amount of additional damage to other installations in the area, plus the destruction of housing within radii up to more than 7 miles in the case of the bomb.
If either bombing accuracy is low or the target "hard," then even for the individual target the probability falls off substantially that a 150-KT bomb will get the target. And if hard targets are attacked with low accuracy, something like 18 150-KT A-bombs will be required to destroy each target with certainty.
The effect of having the 25-MT H-bomb is to remove any doubts of the success of our strategic bombing operation based on considerations of bombing accuracy or target vulnerability. Even with smaller H-bombs there is a great increase in the probability of destroying any target.
Another advantage of the H-bomb over the A-bomb will be the important reduction in total campaign costs because the need for reconnaissance will be virtually eliminated. Pre-strike reconnaissance will frequently not be necessary using a weapon with such a large lethal radius, nor will there be as much need for post-strike damage assessment.
Effect on Target Selection and Expected Damage
We have seen that the H-bomb will assure practically certain destruction of any particular target installation. We have also pointed out that a major difference between this weapon and the stockpile A-bomb will be the much greater area of the destruction from a single bomb. This difference suggests a new approach to target selection. Since the H-bomb is an area weapon, the particular criteria by which exact DGZ's are selected ceases to be of such crucial importance. This is illustrated, we feel, if one first proceeds to apply target selection criteria currently employed, considering the H-bomb as the weapon.
Selected Industrial Targets and Industrial Concentrations
We now are virtually certain to destroy with a single weapon delivered over the target installations selected on the basis of the "vertical industrial bombing" criteria. This means, for example, that about 60 25-MT bombs, properly placed, would destroy 80 percent or more of the following vital industries in the Soviet Union: steel, aluminum, petroleum, aircraft engines, and airframes. This target list is used here only for illustrative purposes and is not intended to represent a "recommended" target system. The industries included are all relatively important to Soviet Union economic war potential, but we recognize that many other considerations must be brought to bear in selecting a target system, such as the particular strategic situation at the time of attack, knowledge of Soviet stocks of various types of equipment, operational factors, and so forth. Table II indicates the number of plants included in each industry and the total percent of capacity accounted for. The "multiple kill" potential of this weapon is illustrated in this example: While there is a total of 72 installations represented by this target list, the number of DGZ's required is less than 60.
|
TABLE
II |
||
|
Industry |
No. of Plants |
Percent of Capacity |
|
Steel |
26 |
82 |
|
Aluminum |
9 |
82 |
|
Petroleum |
10 |
80 |
|
Aircraft Engines |
10 |
86 |
|
Airframes |
17 |
80 |
|
Total No. of Plants |
72 |
|
While much longer industrial target lists are often considered in official planning, it is our view that the completeness of the destruction anticipated to the installations attacked, coupled with the destruction of the hundreds of other plants located within the lethal area covered by H-bombs aimed at this selected list of plants, is such that, given a short list of the sort examined here, the productive potential of the Soviet Union would be effectively eliminated.
[However, we are not saying that such an attack would automatically eliminate the S.U. from the war. Her military force in being at the time of such an attack might well fight an effective ground campaign out of stocks on hand for a considerable period of time. If this campaign secured a large part of Western Europe for the Soviet, she might be able to make good much of the damage to her own industrial capacity.]
The recuperation burden placed on the Soviet economy resulting from such widespread destruction would be so great as to require years before Soviet output could be restored to its pre—attack levels. Some would go so far as to argue that the destruction of 80 to 90 percent of only steel, aluminum, and petroleum might be sufficient to assure ultimate Soviet defeat.
While the delivery capability and total number of conventional A-bombs required to effect comparable damage to this same target list will depend critically on the vulnerability and bombing accuracy assumptions one makes, it is clear that a much greater effort would be required.
Of equal significance, however, is the major difference between the two weapons when one compares the incidental effects of their use against such a target list. The important conclusion here is that, whatever the criteria used for selecting targets and DGZ's, the 25-MT Bomb is inevitably an area and not a point target weapon. For the sample target list suggested in Table II, we have estimated the mortalities which could be expected if the H-bomb were employed. Attack against all 72 installations in the five industries with the 25-MT bomb would result in about 15 million mortalities. If only the steel, aluminum, and petroleum targets were attacked, mortalities would be an estimated 10 million. Based on what information we have about the location of the dwellings of the Russian labor force relative to the plants in which they work, such an attack would not only level the plants but kill a very high proportion of the workers.
If, as in the case of recent recommended target lists, we selected several hundred industrial plants as our GZ's, this would result in the virtual destruction of almost every Soviet city and a death toll of 30 or 40 million or more.
[ Assuming no evacuation and no special shelter program. See section on mortalities.]
For if this weapon is used against industrial installations, even where they are on the periphery of the city except for the very largest cities, complete destruction of housing and most other buildings can be expected. The companion RM-[BLANK] estimates that with the 25-MT bomb all housing will be collapsed within a radius of 7 miles from ground zero, which is greater than the diameter of the significant built-up areas of most cities. Extensive damage would be experienced well beyond the 7 mile range.
Even where mortalities are materially less than estimated in Table III (below, p. 16) because of the extensive use of shelters, evacuation and other casualty-reducing measures, the complete elimination of almost all large cities as existing entities, coupled with the resulting industrial damage, would have consequences beyond our ability to assess in any meaningful fashion.
Suppose that we wished to minimize casualties and still accomplish the same strategic bombing mission against industrial installations. We could deliberately give preference to target industries and plants which are well outside major centers of population. As an example, we estimate that it would be possible to destroy nearly 80 percent of the capacity of the Soviet steel, petroleum, and aluminum industries and cause heavy incidental damage to other industries while inflicting "only" about 7 million mortalities.
[It should be emphasized that this tactic involves attacking a very short, select list of industrial targets. This list differs from that cited above (Table II) by the exclusion of a few plants near large population centers.]
Atomgrads and many counter—air targets and other military installations could also be attacked without adding significantly to civilian casualties.
If we consider a more extensive target list, we might still refrain from using the H-bomb against such targets as the Moscow aircraft industry installations, since a large proportion of the estimated casualties would result from the attack on this city. We might, in this case, use conventional A-weapons against these plants. It should be noted, however, that unless CEP's are good, the large number of A-bombs of currently stockpiled size which would have to be dropped to get a high probability (on the average) of destroying the target plants, would result in very extensive damage in the areas surrounding these plants. If, to take an extreme case, 6 to 8 150-KT bombs were required before a given plant in Moscow were knocked out, then the total expected area of destruction (but not the mortalities) would be comparable to that caused by a single H-bomb.
Another possible method of reducing urban casualties would be to warn the target population in areas to be attacked to permit evacuation, use of shelters, etc.
The prospect of megaton yield bombs makes it much more urgent that we obtain answers to the following questions: How much would warning cost us in losses? To what extent would it endanger the success of the SAC operation? How would our national objectives best be served — by killing the Russian urban population or by scattering it, demoralized, over the countryside and then destroying its factories and homes?
Urban Destruction and Mortalities
We have indicated our view that no matter how DGZ's are selected, the H-bomb must be regarded as an area weapon. Thus, even though the exact aiming points are determined with reference to a selected industrial target system, the primary objective being the destruction of major proportions of the capacity in a relatively small number of key industries, the effect will be not only widespread damage to other, non-target, industrial installations, but the wholesale devastation of Soviet cities and very high civilian mortalities.
To illustrate the "kill potential" of the H-bomb, we have estimated the casualties which would result from bombing S.U. cities, selected in the order of their population, with the city centers as GZ's. The purpose here again is to indicate orders of magnitude. In this case, we ignore CEP (see below, p. 21) for its effect on the results) and we assume no warning and no special shelter program and no evacuation. Essentially, this means that we assume simultaneous attack against all urban concentrations considered. We do not present these mortality estimates (nor those presented later for the U.S.) as a realistic assessment based on a careful campaign analysis. Rather, we wish, first, to indicate the tremendous difference between this weapon and the A-bomb; second, to emphasize the general range within which the absolute numbers are expected to lie if the H-bomb is employed; and, third, to present a standard against which we can assess various measures to protect the population, discussed below on p. 36 ff.
In the Appendix, the reader will find a table listing some 50 of the larger Soviet cities. We have made some rough calculations estimating the distribution of the population in these cities in a central core and two or three annuli around this core. The Appendix describes the method used in this operation. RM-[BLANK] describes the derivation of the relation which indicates the expected percentage of population at risk at various distances from ground zero who would become mortalities. This relation has been approximated by the mortality distance relations indicated in the Appendix. Applying these expected mortality rates, which assume no warning, no shelter, and no evacuation, we get the results summarized in Table III.
|
TABLE
III |
||||
|
No. of Bombs |
5-MT |
25-MT |
||
|
Mortalities |
Cumulative |
Mortalities |
Cumulative |
|
|
5 |
6.9 |
6.9 |
8.4 |
8.4 |
|
10 |
3.1 |
10.0 |
3.5 |
12.0 |
|
15 |
2.5 |
12.5 |
2.7 |
14.7 |
|
20 |
2.2 |
14.7 |
2.4 |
17.1 |
|
25 |
l.8 |
16.5 |
1.9 |
19.0 |
|
30 |
1.4 |
17.9 |
1.5 |
20.5 |
|
35 |
1.4 |
19.3 |
1.4 |
21.9 |
|
40 |
1.3 |
20.5 |
1.3 |
23.2 |
|
45 |
1.0 |
21.6 |
1.1 |
24.3 |
|
50 |
0.8 |
22.4 |
0.9 |
25.2 |
|
* The sums of the mortality estimates for each 5 bombs do not necessarily add to the cumulative totals due to rounding. |
||||
In Moscow and Leningrad, under the assumptions made here, we estimate that with 25-MT bombs mortalities would be about 7 million, (in this case we chose two DGZ's in Moscov and one in Leningrad so as to maximize mortalities.) The first five bombs delivered on this basis would cause 8.4 million mortalities, the first 10, 12 million, while 50 bombs would cause more than 25 million. The total population in these 50 cities is about 27 millions, so that this weapon, on these assumptions, kills a fantastic 93 percent of the total. The table illustrates the ranges to be expected under the same assumptions with the 5-MT bomb. While not quite as lethal, the results are of the same general order.
Even if we recognize that these figures may be overestimates due to our failure to allow for warning, evacuation, and shelter protection (*), it is clear that the structural damage would be so widespread as to leave the surviving population without housing, and the city without most of its service, distribution and governmental structures.
[* - However, as the Appendix indicates, the "population at risk" figures are underestimates in many cases because our population data is based, in most cases, on the city population, the city defined along conventional political sub-division lines. Contiguous, urbanized areas and their population are not in general included.]
Except for the largest cities, almost all the built-up areas lie within the zone (7 mile radius for the 25-MT bomb) in which all housing is collapsed if the city center is the ground zero.
It is our view that it may be meaningless to draw a sharp distinction between an attack directed at cities, as such, with city centers as DGZ's and attacks directed against selected industrial targets (if the number of such targets is comparable to the target lists of recent war plans). A large proportion of the capacity of major Soviet industries is located in or near the larger cities. It is true that "tough" industrial installations may survive complete destruction if the 25-MT bombs go off over the city centers. But the general devastation of the cities would be on such a scale that it seems to us doubtful if the physical survival of part of the plants' facilities would be of great significance, especially if such attacks occurred more or less simultaneously against all major industrial centers. The large number of casualties among the industrial labor force enforces this view. In brief, a single 25-MT bomb would probably end the existence of all but the largest target cities, at least for a period measured in years rather than months.
The implications of this weapon for Soviet strategic bombing capabilities are qualitatively the same as for our own. But from a long-run point of view, it helps then more. To us it is a luxury which increases the certainty with which we can accomplish a mission. But the Soviets are today at a considerable disadvantage in any attempt to launch a strategic attack on the U.S. In the first place, they have had no experience in strategic bombing and would, we hope, lack finesse in selecting targets and in conducting the operation. In the second place, they have no advance bases: the only way in which they can now deliver their A-bombs on most U.S. targets is by flying one-way missions with TU-4's. Finally, they would be attacking a much larger and more resilient economy, so that they require many more bombs on target to knock out our industrial potential than we would require to destroy the Soviet potential.
If they should have H-bombs with megaton yields, there are at least two ways in which it becomes feasible for them to knock us out — at least in the sense of preventing effective mobilization of our industry after a war begins and after the strategic bombing strike has been made.
Selected Industrial Targets and Industrial Concentrations
First, they could direct an attack against key industries such as steel, petroleum, aluminum. In the U.S., 42 plants account for 80 percent of steel ingot production (and, because of integration, comparable percentages of semifinished and finished steel products as well as most of the pig iron and coke facilities in the country). Sixty plants account for 90 percent of steel output.
In petroleum, about 60 refineries account for 70 percent of capacity, 90 for 80 percent. In aluminum, concentration is much higher. Some 12 plants account for all aluminum output while five produce all our alumina. Fever than 10 plants account for virtually our total Jet and piston aircraft engine output. The number of H-bombs required to destroy these very large proportions of such vital industries would be fever than the number of individual plants, even allowing for CEP, and the destruction of these plants would be accompanied by wide—spread destruction of thousands of other industrial installations and the cities in which they are located.
[Thirty of the 42 largest steel plants are located in the 50 largest metropolitan areas which contain the bulk of our industrial capacity. Two-thirds of the 60 largest refineries are found in these large metropolitan areas.]
Urban Destruction and Mortalities
The second way in which the Soviet could knock us out is by destroying our major cities. Suppose the Soviet H-bomb attack is so designed as to achieve maximum casualties to the U.S. population? With relatively few bombs they can destroy most of the built-up areas in our cities, causing mortalities of staggering proportions and, in fact, wiping out our urban civilization. Table VI in the Appendix lists the largest population concentrations in the United States. The primary ordering in this table is by "urbanized areas" as defined by the U.S. Bureau of the Census. The same areas are also ranked by population in "metropolitan areas," by the population of the main city of the area, and, finally, our estimates of the population living within a 6 mile radius of the center of the city. We selected all urbanized areas with a population of 250,000 or over, of which there are 49, containing 55 principal cities. The total population in the listed urbanized areas is 55 millions, or more than 1/3 of the total U.S. population.
We have estimated the expected mortalities assuming an attack with 5-KT and 25-MT H-bombs against the largest urban areas, with ground zero's selected so as to maximize the death toll, using the same mortality-distance relation applied above to the Russian data. If we apply these expected mortality rates to large U.S. population centers, we get the estimates indicated in the following table.
[ Attention is called again to the remarks on page 15 above as to the significance of these casualty estimates. They are not intended as a realistic forecast, but are presented here to demonstrate the nature of this weapon and the implication of its possible employment against this country. Specifically, in this case where we consider the use of the H-bomb against U.S. urban centers by the Soviets, we are not implying any judgment as to their delivery capabilities. In other words, we are not predicting that they could or would direct a simultaneous attack against our 50 or so largest urban areas. That they might be able to do this is sufficient for us, since the results of such an attack, indicated by our estimates presented here, highlight the urgent necessity of our preventing such an occurrence. This will be discussed below when we consider defense.]
Appendix I describes in detail the method used in obtaining these estimates.
|
TABLE
IV |
||||
|
No. of Bombs |
5-MT |
25-MT |
||
|
Mortalities |
Cumulative |
Mortalities |
Cumulative |
|
|
5 |
6.6 |
6.6 |
11.9 |
11.9 |
|
10 |
3.3 |
10.0 |
5.1 |
17.0 |
|
15 |
2.8 |
12.8 |
3.9 |
20.9 |
|
20 |
2.1 |
14.9 |
3.2 |
24.0 |
|
25 |
1.7 |
16.6 |
2.5 |
26.6 |
|
30 |
1.5 |
18.1 |
2.0 |
28.6 |
|
35 |
1.3 |
19.4 |
1.6 |
30.2 |
|
4o |
1.2 |
20.6 |
1.5 |
31.7 |
|
45 |
1.1 |
21.7 |
1.4 |
33.0 |
|
50 |
1.0 |
22.6 |
1.2 |
34.3 |
|
55 |
0.9 |
23.5 |
1.1 |
35.3 |
|
* - Bombs are ranked in Table IV above in order of mortalities caused. The following urban areas receive more than a single bomb: New York — 3, Chicago — 2, Los Angeles — 3, San Francisco — 2. Not included in the above is the expected mortality figure for a single 25-MT bomb with GZ at New York's Central Park. This one weapon, under the assumed conditions, would cause an estimated 7 million mortalities. Instead, the three GZ's in the New York area were so selected as to inflict maximum total mortalities in the whole area, and no single bomb would cause quite as great a number of mortalities as this one detonated over Central Park. ** The sums of the mortality estimates for each 5 bombs do not always add to cumulative totals due to rounding. |
||||
By way of comparison, Table V shows the mortalities that we might expect from an attack using various numbers of large A-bombs (CEP is ignored as in the H-bomb estimates. In this case the results are much more sensitive to this factor than with the larger yield bomb). Casualty estimates from A-bombs are subject to very great uncertainties but we believe these figures are of the right order or magnitude if the attacks are made without warning. The large numbers of A-bombs required make it more probable than in the H-bomb case that evacuation prior to some attacks will substantially reduce casualties.
|
TABLE
V |
|
|
No. of Bombs |
Mortalities |
|
10 |
2.5 |
|
25 |
6 |
|
50 |
9 |
|
100 |
l3 |
|
150 |
16 |
|
200 |
19 |
|
250 |
20 |
|
* -- These figures were derived from an estimated relationship between the number of bombs delivered against U.S. cities and the number of persons rendered homeless. |
|
The bombs were stated to be 50-KT but more recent RAND investigations indicate that bombs producing the assumed damage patterns would, in fact, be at least 150-KT.
To the estimated number of persons made homeless we applied a ratio of killed to homeless (0.6) based on data in The Manhattan Engineer District, The Atomic Bombings of Hiroshima and Nagasaki (1946), pp. 13-19, and in the U.S. Atomic Energy Commission and the U.S. Department of Defense, The Effects of Atomic Weapons (New York: McGraw-Hill Book Company, 1950), Fig. 12.15, p. 376.]
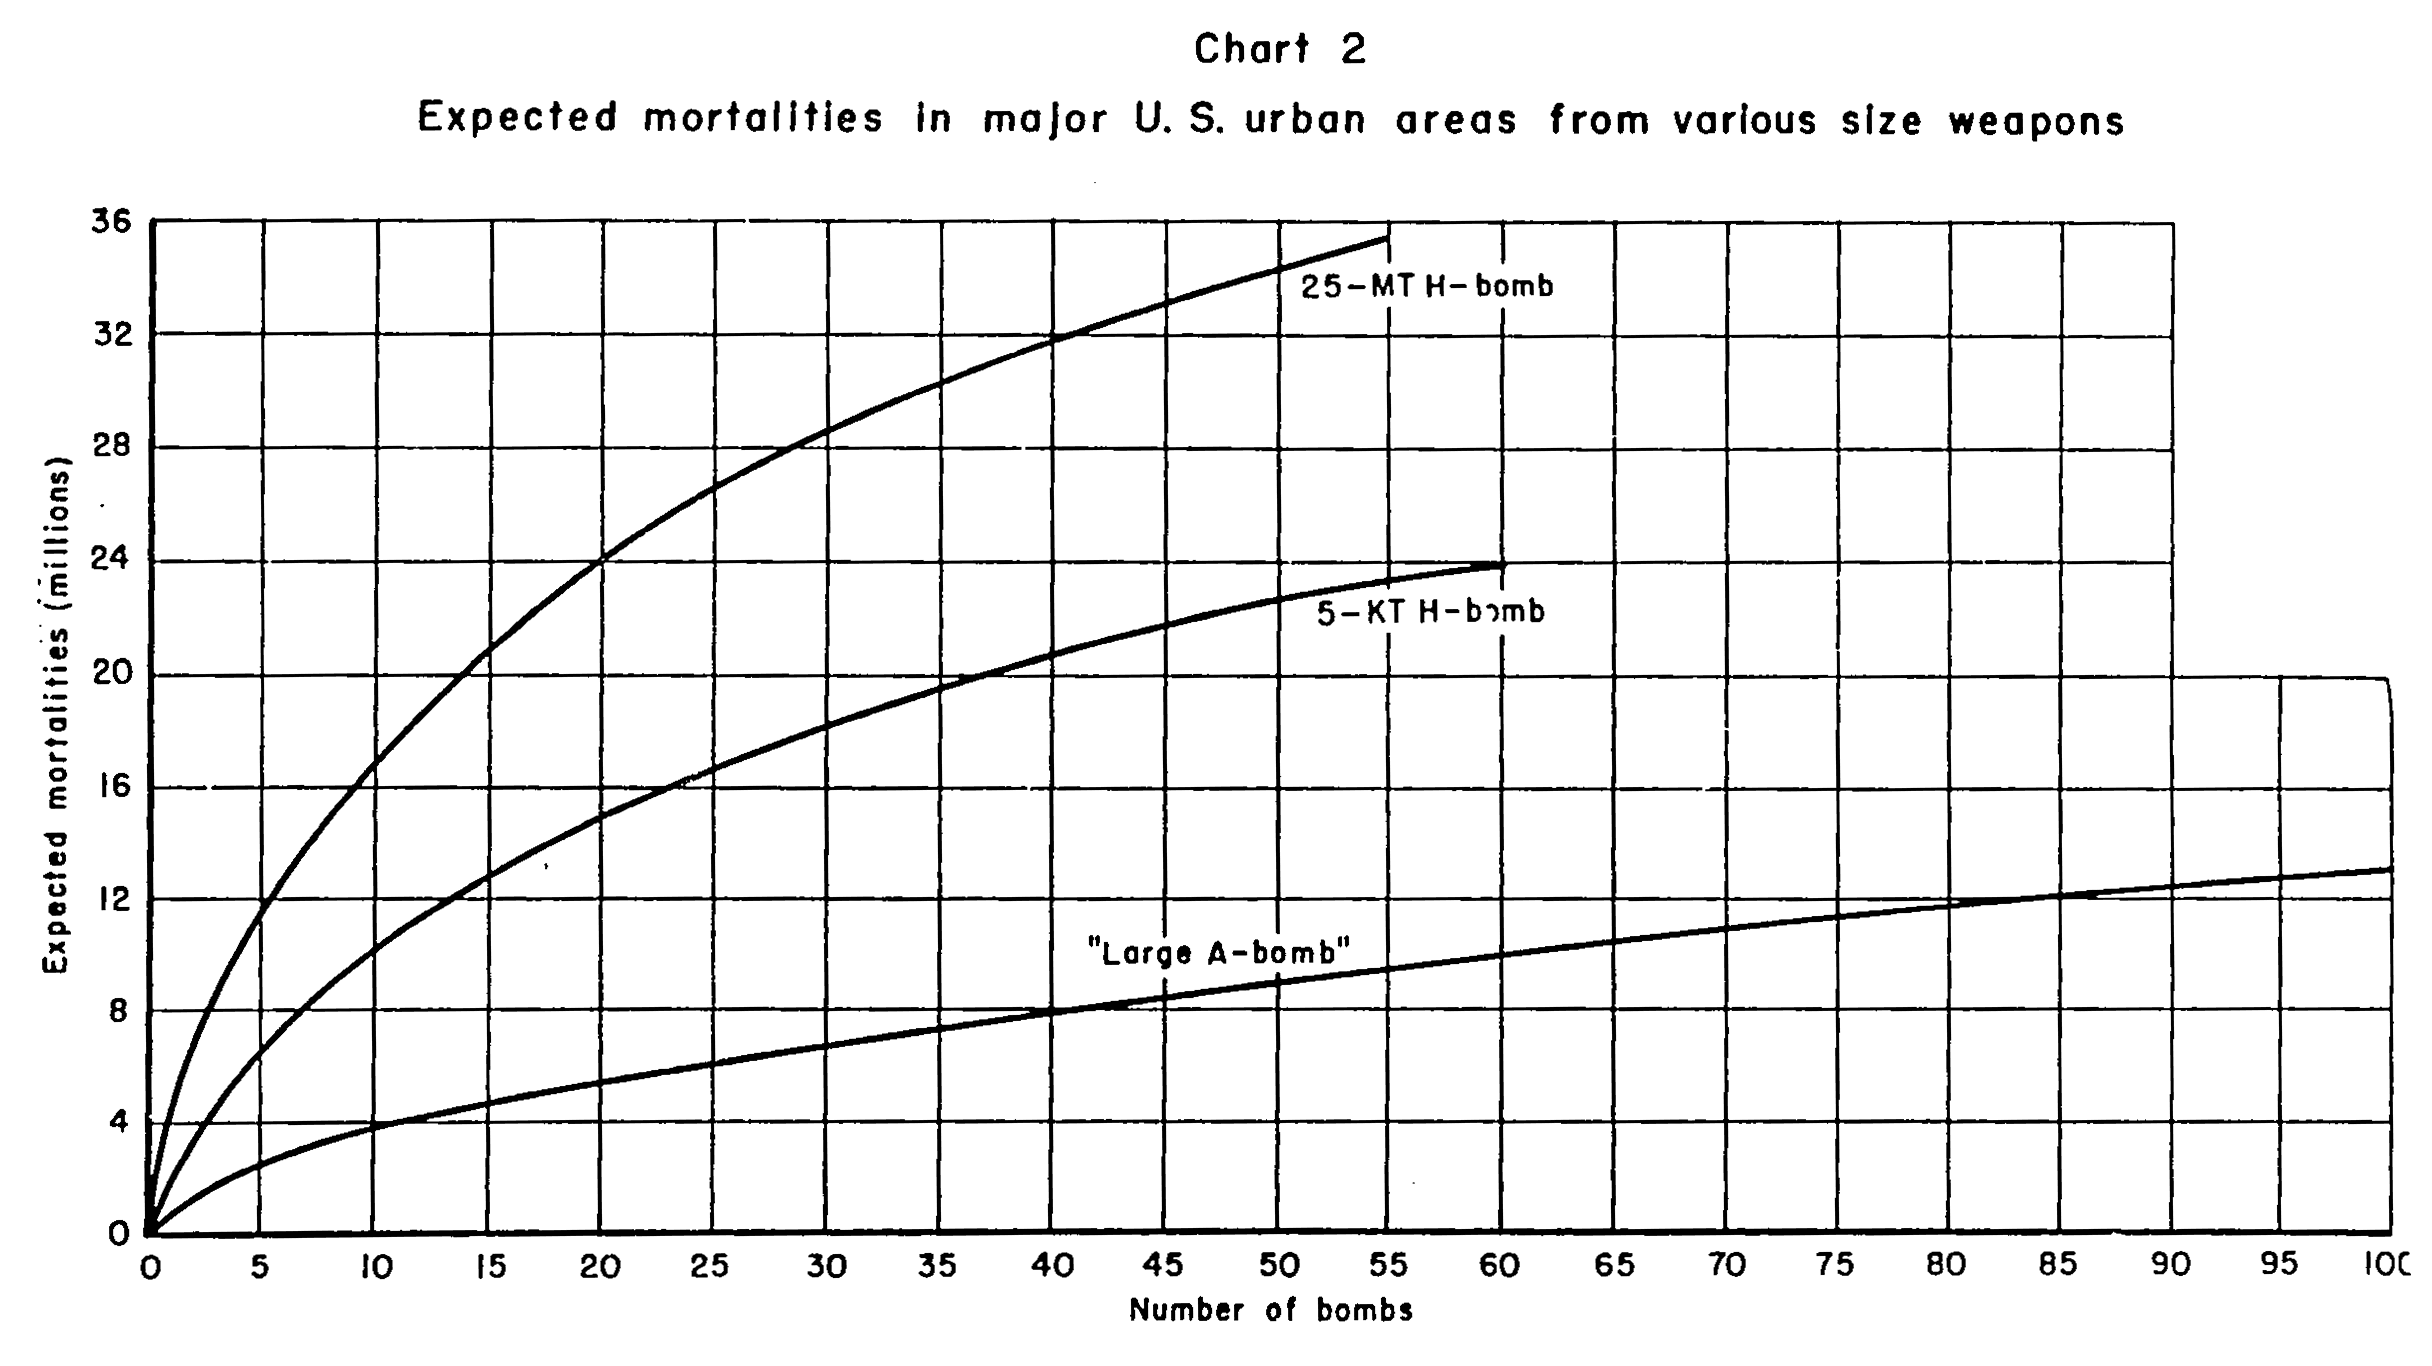
Chart II compares the expected number of mortalities which would result if 150-KT A-bombs and 5-MT or 25-MT H-bombs were detonated at ground zero's selected so as to maximize casualties in major U.S. urban areas. Again, if CEP were considered, the A-bomb results would be much more sensitive to this factor than H-bombs of either yield.
As in the case of our use of the H-bomb against the Soviet Union, if the Soviets use it against the U.S. on a large scale the results obtained will not be much affected by the particular choice of ground zeros. As they drop more bombs on more targets, the effects of a city attack and a selected industry attack merge. The important point is that with small numbers of megaton—yield H-bombs and with no great finesse, they can accomplish against us the sort of strategic bombing mission which we assign to SAC.
In the short run, the Soviets have a delivery problem that might be quite serious. The only long-range bomber which they now possess in operational quantities is the TU-4, which could not even lift the heavier of the expected H-bombs. If a production model H-bomb weighs on the order of 20,000 pounds, it could presumably be delivered by the Type 31 plane Been in Moscow in May, 1951, in the same manner that the TU-4 can deliver the A-bomb. In the slightly longer run, it is certainly not beyond Russian capabilities to solve the delivery problem. If they learn to make the bomb, they can certainly develop some means of delivering it in the quantities required, which are not great. It is also important to remember that Washington and cities containing one—third of our war industry are located within fifty miles of an ocean coast — within easy lobbing distance of Soviet ships and submarines.
Effect of CEP on Mortality Estimates
The estimated mortalities resulting from attack against Soviet and U.S. population centers indicated above are not materially reduced if one takes account of the effect of CEP. We estimate that with a CEP of 6,200 ft., mortalities with the 25-MT bomb would be reduced by about 5 percent in either country, if attack was directed at the DGZ's assumed above. With the 5-MT weapon, the effect of CEP is, as expected, greater, with an estimated 8 percent reduction in mortalities in the Soviet cities, 10 percent in the U.S. Smaller CEP's would, of course, result in even smaller reductions. We think it appropriate to conclude that when estimating the effect of H-bomb employment against urban areas or industrial concentrations, CEP can safely be ignored, and this is true even where we are interested in particular "point" targets, as Table I illustrates.
We have indicated that in our view the comparative position of the U. S. vis-a-vis the S. U. from the strategic bombing standpoint will be worsened if both nations develop the H-bomb. It is true that Soviet economic vulnerability to an attack is greater than ours because of our larger industrial base and much greater "cushion" of output in most industries representing production of non-essential items, the larger number of installations accounting for any given percent of capacity in most U.S. industries, and the fact that our large industrial concentrations appear to account for a smaller part of total industrial capacity than a similar number of USSR concentrations.
However, we must not be misled by this apparent relative advantage since the important point is that with the H-bomb the Soviet Union would have the capability, even if she could only deliver a relatively small number of bombs over U. S. targets, of striking a devastating blow at our economy, and there is serious question as to her ability to do this with the A-bomb. Since we may already be able to do something like this to her with the A-bomb, the H-bomb represents less of a gain to us and our comparative advantage will be greatly reduced.
Moreover, our population is much more concentrated in large urban centers. A given number of H-bombs, especially the largest size considered here (25-MT), will cause more casualties in the U.S. than in the Soviet Union. There are an estimated 27 million people living within 6 to 8 miles of the city centers of the largest 50 Soviet cities, while in the U.S. there are at least 40 million. As a consequence, we estimate, for example, that twenty-five 25-MT bombs could cause an expected 27 million mortalities in the U.S. as compared with 19 million in the USSR, while 50 bombs would result in about 34 million in the U.S. and 25 million in the USSR. However, due to differences in population distribution between cities in the two countries, the smaller H-bomb of 5-MT would cause approximately the same number of casualties in the two nations. In general, U.S. urban areas have larger total populations than Russian cities but cover a wider area, so that the density of population, especially close to the city centers, is considerably higher in Russia than in the U.S. The effect of automotive transportation and the resulting prevalence of suburbia in the U.S. account for this difference.
One conclusion of the preceding sections is that at some date, perhaps five years hence, plus or minus, the Soviets may be able to drop bombs on us over a short period of time (even possibly in a single night), which would, at a minimum, prevent our industrial mobilization, wipe out many, if not all, of our large metropolitan centers, and cause casualties in the millions. At a maximum, such an attack may prevent us from carrying on the war at all.
We assume that we will be able to do the same or worse to the Soviets, but we have always von our wars in the past by mobilizing our superior industrial strength after war begins, relying on our inaccessibility and invulnerability to give us time to do so. This concept still appears to dominate most of our strategic planning. If, after mutual H-bombing of the sort discussed above, the war goes on in any sense, it will be fought with men, military forces in being, and stockpiles of war reserves — in all of which the Soviets now outnumber us. How, in the broad sense, can we defend the United States and our Allies from this catastrophe?
We have no answer. This section is devoted to an examination of some possible answers, and suggests that, in our view, some programs which have been proposed are impossible or impractical, while others look so promising as to deserve serious consideration.
The best way to avoid such a catastrophe — and the only way of avoiding any serious damage — is to keep the attack from being made. We do not propose in this paper to explore all the problems and possibilities for effecting this result. We do suggest that the strongest military deterrent to such an attack on the U.S. is a strong retaliatory force in being armed with H-bombs. The absolute priority for the defense of the U.S. is, therefore, the effective protection of SAC from a surprise Soviet attack.
The deterrent effect of our retaliatory force can be reinforced by measures which at least raise doubts in Soviet minds about the success of their own attack. These are the defense measures proper, of which we shall consider four: active air defense, dispersal of industry and population, the stockpiling or accumulation of war reserves, and other measures to reduce the vulnerability of our population. It is important to note one characteristic which these four measures have in common: while we think the threat of H-bomb attack is five years in the future, plus or minus, it would take five years to achieve a substantial defense using any of these measures if we started immediately and acted with the utmost vigor.
Active Air Defense
The RAND Study concluded that there was a chance of erecting a defense system within, say, five years, with a very high "kill potential" against Jet bombers. Whether this "kill potential" would result in actual attrition rates high enough to keep the damage inflicted by A-bombs within tolerable limits would depend on intangible factors which are very difficult to evaluate. Most of these intangibles are associated with the initial degradation of the system due either to surprise tactics on the part of the enemy or simply less than perfect alertness on our part. But at least such a defense seems possible. If the attack is assumed to be made with H— bombs, the task of the defense is obviously more difficult. We may be able to absorb a large number of A-bombs and recover, particularly if the targets selected are not optimal or if bombing accuracy is poor; we cannot stand fifty 25-MT bombs if they are well placed, and the results are not very sensitive to the placing. So defense which achieves a tolerably high attrition rate with present A-bombs is inadequate against an H-bomb attack.
There are two problems in achieving higher attrition rates — one relatively easy and one difficult. The relatively easy problem is to raise the "kill potential" — i.e., the number of bombers shot down if all goes as planned and if all our defenses ere engaged. This involves pushing the warning network out and increasing the number and deployment of the most efficient defense weapons. It would cost a great deal of money and resources, but appears well within our capabilities. Even if it costs ten billion dollars a year, that is only three percent of our Gross National Product, and it may be argued that we spend comparable sums to achieve less vital objectives.
The more important and difficult problem is to take the extraordinary measures required to defeat the intangible enemies of any successful defense. The problem is a familiar one and is being worked on by others in RAND. We do not know whether any practical measures can provide insurance against a sneak attack employing unconventional tactics. The measures which appear to be necessary present special difficulties in a democracy in time of peace.
If the H-bomb is the threat, it is essential to build up active air defenses to the point where further improvement in the systems' kill potential becomes prohibitively expensive. For we feel that the deterrent effect on the Soviet Union of an active air defense which could exact a high cost on their strategic striking forces may prove very important — whether the limiting factor on their effort is bombs or means of delivering them. On the other hand, we cannot place sole reliance on active defenses since even a very few H-bombs which get through can do such fantastic damage.
The possibility that the Soviets may develop the capability of delivering H-bombs in missiles launched from submarines or employ other non-conventional delivery techniques, cannot be ignored. Such developments might mean that certain regions of the country, particularly coastal areas, are especially vulnerable. We have not attempted to consider here the special problems introduced by this threat.
Dispersal
[In the following discussion of dispersal and stockpiling a war reserve, we have borrowed freely from work done on these subjects by G. Cooper and E. McKean of the RAND Economics Division, though they do not share responsibility for our conclusions. Their study emphasizes the necessity of our devoting considerable attention to the many passive defense policies open to us, so as to arrive at the best combination of measures designed to reduce our vulnerability, within the limits imposed by our capabilities.]
Many will be tempted to meet the threat of this bomb by dispersing our cities with their population and industry. Dispersal can take many forms. It can, in the first place, be general or selective. A general dispersal would include major cities and everything in them, while selective dispersal might be confined to military installations and certain very critical industries or plants. Industries can be dispersed with or without a reduction in the average size of plants. Dispersal can be within the same metropolitan area or county, the objective being simply to insure a distance between any two important plants related to the expected lethal radius of a bomb and the reduction of the density of capital and population; or it may involve moving to the interior or to regions of low industrial density. The worths and the costs of these different kinds of dispersal vary enormously. The subject is extraordinarily difficult and complicated and has been little studied. This section will merely outline some reasons why general dispersal is not the major part of the answer to the threat of the H-bomb.
[Selective dispersal, particularly of military installations, is an important part of the answer. See p. 39 below.]
The first reason is that general dispersal is fantastically expensive if we attempt to accomplish it within a few years. Dollars represent economic resources and a general dispersal of our cities would require so many dollars and resources that it would prevent us from doing anything else that is important during the next decade. We estimate that if we used our entire surplus over current consumption levels (including that part of the surplus now going into new military procurement) to disperse generally our industry and population, we could have, by 1960, a new dispersed economy somewhat smaller than our present one.
A second reason why general dispersal is not the major part of the answer is that a great deal of dispersal may buy very little protection. If dispersal assumes any particular form, the attacker can, within limits, simply change his aiming points and attack a different target system. There are alternative ways in which he can knock out our industrial mobilization potential. If we decide that the greatest threat is to our major cities, we could spend the next ten years dispersing our cities and it would still be possible for him to launch a completely successful "vertical" attack against basic industries which are essential to war production, the location of which might scarcely be affected by city dispersal. Conversely, if we put a tremendous effort into dispersing and reducing the size of plants in our basic industries, our cities and their populations would remain almost as vulnerable as they are now. Moreover, unless dispersal is combined with a very active air defense, it merely increases the number of bombs required on target: these bombs are apparently cheap and because they are cheap they will, in time, be plentiful. If attrition rates are low, delivery is also cheap. The Soviet could easily keep ahead of us by making more H-bombs and more planes if we did nothing but disperse.
Finally, there is a serious question whether a general dispersal program which would achieve any significant degree of protection could be implemented and still be consistent with free enterprise and democracy. There seem to be only two ways in which general dispersal might be accomplished, both of which are, in our opinion, unacceptable. The first is by detailed planning and direction from Washington, with the government deciding where every plant should be, how large it should be, etc. The other would be to educate or frighten people sufficiently to induce them to disperse on their own initiative. We doubt whether this could be done; if it were, it would result in a great deal of inefficient, damaging, irrational action.
Stockpiling War Reserves
A partial answer to the threat of the H-bomb may lie in a massive stockpiling policy with special emphasis on the stockpiling of finished military equipment and supplies. We have a policy called stockpiling now, and have spent or are about to spend the sum of four billion dollars on it. But it is designed to protect us from a lesser danger — the danger that imports of strategic raw materials will be cut off in an emergency.
For a war in which massive strategic air blows are exchanged (this is the only kind of war we have to think about in this context because otherwise we retain our mobilization capability) we certainly need a SAC, an Air Defense Command, and possibly the forces required to hold in the major theatre (presumably Europe) — ground forces, TAC, and a Navy. We estimate that the present build-up of forces, when completed, say, in 1955, will leave us with military equipment worth about 100 billion dollars at present prices. This is a very large sum. Our cumulative munitions and equipment production during World War II was only about 250 billion dollars at present prices. This 100 billion dollars could be regarded as the beginning of a stockpile for an atomic war which would prevent us from mobilizing and producing more after war began.
It could be supplemented with more of the expendables to make each of our major commands capable of operating on an austerity basis for an extended period with no fresh supplies from the economy.
[Some of the expendables (food, ordinary petroleum products, and perhaps clothing) are produced in facilities which are so dispersed and, in general, so far from major population centers that some continued supply could be counted upon even following a successful H-bomb attack.]
Perhaps something like this is the planning concept that we need in an H-bomb age. Of course, both the 100 billion dollars of equipment and the rest of the war reserve must be protected by dispersal or by storage in underground locations. This is, we think, an entirely feasible policy and well within our means.
We have not been able to estimate what it would cost to put this concept into effect. This would involve determining the amount of materiel required and the rate of obsolescence.
[ In the case of materiel subject to very rapid obsolescence, like some electronics equipment and, perhaps, some combat aircraft, it would possibly be desirable to rely in part on the selective dispersal or underground construction of manufacturing facilities and the stockpiling of the materials required by the facilities, rather than exclusively on the stockpiling of the finished equipment. In addition, once a war reserve was accumulated, a "first in, first out" inventory policy of replacing part of the stockpile each year could be established. In this way, late—model equipment would be incorporated into the reserve as it became available. Finally, obsolescence in this case is a relative matter, and we can expect that our stockpile vis-a-vis the Russian's will be, at worst, no more out of date.]
Before we could make such an estimate we would have to think through the problems of the ground battle. Our tentative opinion is that it would cost much less than enough general dispersal to give us an equivalent amount of invulnerability.
Our view that stockpiling a war reserve possibly represents an effective passive defense measure, is, as we have said, not based on a detailed examination of such a program. We urge that such detailed examination be undertaken. It may well prove true, that an "across—the—board" war reserve is not called for, but instead a much more selective program. In any case, there are certainly priorities in such a program. Specifically, it seems to us that whatever the final conclusion on a war reserve for all commands, we must have either in reserve or as a force in being a strong strategic air force. We have discussed this need already.
An advantage of war reserves over dispersal and many other passive defense measures, designed to protect our ability to fight a war if it should come and we should be subjected to air attack, is that a stockpiling program of the sort suggested here may give us this capability regardless of the particular target system chosen by the enemy, the exact magnitude and effectiveness of his attacking force and weapon, etc., while a dispersal program can be rendered more or less useless by a change in enemy strategy or capabilities.
Comparison of Various Measures
Which combination of these three defense measures — active air defense, general dispersal, war reserves — will be the most efficient in deterring a Soviet attack by raising doubts about its effectiveness, or in protecting us so we can fight if deterrence fails and the attack is made? Let us turn the question around and ask which of these measures, that either have been or might be pursued by the Soviet, raises the gravest doubts in our minds about the success of our own strategic bombing. In our view the answer is (a) var reserves and (b) active air defense, in that order. What we fear most and can do least about is that the Russians will have men and equipment to achieve their military objectives from stockpiles in spite of our strategic bombing. Next, we worry very much about the ability of our bombers to penetrate. We may worry excessively; it may be that the bombers will always get through; but we cannot be sure that MiG-15's or Wasserfall's or something will not shoot them down in droves when they try. To summarize the comparisons of these defense measures:
(1) Active air defense appears to be the most economical of the three if it can be made to work. Moreover, it does have special value as a deterrent. If the Soviet attack fails because of active defenses, they lose not only their bombs but also their elite crews and very valuable bombers. The deterrent value of an active air defense probably Justifies a substantial investment.
But:
(2) We can never be sure that our defense system will be effective against sneak attacks and unconventional tactics. Therefore, we cannot place full, and probably should not place major, reliance on active defense.
(3) Active air defense and dispersal (including dispersal of our military forces as well as of industry and population) are not alternatives but complement each other. Dispersal in itself merely increases the number of bombs required on target; active air defense reduces the number of bombs delivered on target. Dispersal may intensify the active defense problem by creating more areas requiring defense.
(4) General dispersal on a scale to provide real protection appears impracticable, and, if practicable, prohibitively expensive in the short run. It involves building most of the United States in a different place, and if we attempted this during the next decade we could do nothing else.
(5) Stockpiling war reserves of equipment and supplies and trained men to enable us, at a minimum, to carry on a strategic air war and possibly to enable our major commands to fight on an austerity basis for an extended period appears within reason economically and would provide some deterrence and some protection.
Reducing the Vulnerability of our Population
It must be recognized that a mixed policy along the lines suggested above — active air defense, selective dispersal, and stockpiling a war reserve — would do little to reduce the terrible vulnerability of our cities and their populations. There is apparently no practical means of eliminating this vulnerability, but there appear to exist measures which would reduce it at relatively moderate cost.
a) Dispersal of our cities, as we have indicated, appears to be out of the question because of the magnitude of the job, its adverse impact on our productive potential and economic efficiency and the limited time probably available to us. However, there is a trend in urban development away from city centers into suburbs and smaller cities and towns. The least we can do is to stop fighting this trend. It is questionable whether the erection of huge apartment buildings in the downtown areas of New York, Los Angeles, and other major cities is desirable, faced as we are with the threat of an H-bomb attack. For it is certainly true that the higher the density of population per square mile, the greater the number of deaths any given bomb will cause. In addition, when building density is high the incidence of casualties from indirect causes, such as fire, are expected to be much higher than in lower-density areas.
We can even give this "spreading out" trend which is apparent in many cities a push. That is what the current National Security Resources Board dispersal policy amounts to: trying to get new industrial facilities, which are going to he built anyway, located well away from present heavy concentrations. There are other ways which should be explored; for example, the location of public housing projects, and differential rates for war risk insurance. In a period of ten years or even longer, not much protection can be achieved from such measures, but they could give us some.
b) The kind of measure discussed above may serve to reduce mortalities per bomb, but they do not afford protection for the population at risk from any given bomb. Several measures, looking in this direction, still make sense when the H-bomb is the threat. One which urgently requires attention is the design and construction of shelters adequate to give protection from the increased lethality of the H-bomb. Blast shelters of conventional design could be provided cheaply (*), but they are not very effective against the thermal radiation of the H-bomb, and would be death traps where building density is high enough to create firestorms. Shelters which would provide a measure of protection in these circumstances, while certainly more expensive, are feasible to design (**).
[* - -We estimate for about $150 per person for communal shelters in most urban areas, or $5 billion for the entire population of our major cities. The necessary equipment and materials are abundant.
** - We estimate crudely that conventional blast shelters, assuming adequate warning, would reduce mortalities from the 5-MT bomb by one—third, but from the 25-MT bomb by less than 10 percent. (See Appendix, Table II, Case 2.)]
c) Another program which deserves attention is the preparation in advance for large—scale evacuation (especially of children, old people, and others not in the labor force, assuming that adequate shelters can be provided for those not evacuated). We recognize that many objections have been raised against evacuation and time has not permitted a careful analysis of the desirability of such a policy. We feel that the magnitude of the H-bomb threat is such as to require reassessment of all our decisions regarding passive defense.
In the event we have adequate warning before an attack is launched, an evacuation program could be put into operation. In addition, it is possible (some may argue, likely) that the first strike would be against a relatively few places, and, in this case, those centers escaping initial attack could be evacuated. It seems to us that study will indicate that such a careful prearranged evacuation scheme should be in existence if we are to avoid the very real danger of disorganized panic flight from our cities following the first attack.
In addition to considering evacuation planning, attention must be devoted to caring for survivors of attack. Casualty care has received attention in many cities. However, it seems to us that the stockpiling of civilian goods, particularly food, in non-vulnerable locations is equally important. If our major cities were destroyed, and we were able by measures such as those discussed above to keep mortalities within limits, we would face the major task of supporting homeless millions. Plans for feeding and clothing these people, as well as the emergency provision of shelter are essential.
Vulnerability of our Military Force In Being
There are some special risks from H-bomb attacks which we have not had an opportunity to study although they deserve the most serious consideration and planning. A threat of critical importance is to our military forces in being. The dangerous extent to which SAC and the Air Force supply depot systems are concentrated and exposed to atomic attack are well known within the Air Force. Our impression is that the rest of our military forces are almost equally vulnerable. But here — unlike with cities and industries — it is feasible to secure a relative invulnerability. The general character of the policies required — dispersal, multiplicity of bases, active defense, underground storage, etc. — are known, are only moderately expensive when compared with the total cost of our weapon systems, and are well within our capability. Moreover, the measures which would be effective against an H-bomb attack would also be effective against an A-bomb attack, which is an earlier and still a grave threat — perhaps particularly against vitally important military targets.
In discussing stockpiling of war reserves above, we pointed out that if the Soviet attack is heavy enough we can do nothing to prevent widespread damage to our Industrial capacity. The protection of our military forces in being, therefore, becomes of crucial importance since we may be incapable of making good losses once the attack has been made. Again we draw attention to our view that a relatively invulnerable military establishment and particularly a strategic air capability, may serve as one of the most powerful deterrents to the use of this weapon by the Soviets.
Another serious threat results from the concentration within a few miles of the Lincoln Memorial in Washington, D. C. of our civil and military authority. Not only is the high military command located here, but also the great majority of the high officials in the executive, legislative and judicial branches. Serious attention should be given to methods for reducing the danger inherent in this concentration. Complete protection is impossible but unnecessary. In the restoration of civil and military authority following attack it will make a great difference if mortalities at all levels are of the order of 50 percent instead of nearly 100 percent.
Implications for U.S. Air Defense: Summary
In our opinion the possible possession of the H-bomb by the Soviets within the next few years, coupled with their expected ability to deliver this weapon in significant numbers within the continental limits of the United States, so increases the vulnerability of this country as to require much greater emphasis on our air defense — both active and passive, civil and military — than it has so far received. The urgency of the problems cannot be over-emphasized for, though it may be five years before the Soviet Union develops this weapon, most of the programs designed to reduce our various vulnerabilities will require at least this long before they can be effective, no matter how high a priority we give them.
Soviet Defenses
What are the implications of this discussion for Soviet defense against our strategic air attack? Do the Soviets have an equal capability to meet this threat, or a greater, or a lesser one? Our industrial potential is three or four times theirs when we mobilize to an equivalent extent. During the war we did outproduce the USSR, devoting about the same proportion of our resources to direct war use that they did. But, after the war, our military budget fell to 10 percent of what it was during the war, while theirs never fell below 40 percent of the wartime level. There seems to be no doubt that over a long period of cold war the Soviets can make larger proportionate diversions of its resources to military purposes than we can.
To provide an active defense, an equi-proportional diversion of resources by the Soviet is not enough. If we look at the Soviet defense problem, they have an area to defend which is roughly the same magnitude as the area we have to defend. Moreover, they have to defend themselves against attack from more different directions than we have to. While they have somewhat fever targets to defend, the number is not very different. The number of cities in each size category is approximately the same in the two countries. So we can conclude that against the same threat they need absolutely about the same sort of defense that we do. Nov absolutely the same defense means that they must devote a very much larger proportion of their resources to this use than we do. If it takes 3 percent of our national product to provide a near—perfect active defense, this would suggest that it would take about 12 percent of their resources. Our estimate is that in 1951 and 1952 they are only allocating somewhere between 15 percent and 20 percent of their resources to all direct military purposes. So this begins to look like a resource requirement which for them is nearly infeasible. When we further consider that the provision of a very effective active defense requires in quantity extremely advanced electronic equipment, it looks even less feasible, because this is one field in which we feel confident that we have a cooperative advantage in design and in production ability.
As far as the other means of defense which we have discussed are concerned, these are as much within their means as within ours. They can stockpile weapons and trained men and supplies on a massive scale and they can disperse industrial and military targets, at least on a selective basis. We know that they have been doing a good deal along both of these lines already. In continuing, they will face many of the same problems and costs that we do — not quite all, but many — but they will face none which a further diversion of resources cannot overcome.
Coverage of a Point Target
Table I in the text presents the probabilities that nuclear weapons of various yield will destroy a point target if a single bomb is aimed at that target, assuming various CEP's. Appendix Table I translates these results into the number of bombs of various yields required to destroy such a target with certainty.
|
APPENDIX
TABLE I |
||||||
|
CEP |
ZONE (*) |
20-KT |
150-KT |
1-MT |
5-MT |
25-MT |
|
3000 |
2 |
10.2 |
3.1 |
1.3 |
1.0 |
1.0 |
|
3 |
4.4 |
1.6 |
1.0 |
1.0 |
1.0 |
|
|
5500 |
2 |
33.3 |
9.1 |
2.9 |
1.4 |
1.0 |
|
3 |
13.9 |
3.9 |
1.5 |
1.0 |
1.0 |
|
|
8000 |
2 |
62.5 |
18.5 |
1.5 |
2.2 |
1.2 |
|
3 |
27.8 |
7.6 |
2.6 |
1.3 |
1.0 |
|
|
* – Zone II is defined as the annulus around ground zero where overpressure is ≥ 50 psi, Zone III where it is ≥ 20 psi. |
||||||
We felt that a proper understanding of the implication of such fantastically lethal weapons could only be obtained by looking at the results which might be expected if such weapons were used against large population centers. We considered centers in both the United States and the Soviet Union.
The results of our computations are summarized in the text. This Appendix describes the data and method upon which they are based. The nature and reliability of the population estimates and the data on population distribution within cities are quite different for the two nations. It should be emphasized that because of these differences the results for the two are not strictly comparable.
We wish to reiterate our injunction in the Preface regarding the tentative nature of our results because of the imperfections in the data and the methods we used in dealing with them. Our purpose was to get approximations, but we do not feel that the inadequacies are significant and we do not believe improvement in the data will result in significant modifications of our results.
Selection of Cities and Distribution of Their Population
For each country we selected roughly 50 of the largest population centers and distributed their populations In a core and several annuli centered on the approximate center of gravity of the population distribution. The core was 2.5 miles in radius, the first ring from 2.5 to 4 miles, the next 4 to 6 miles. In some cases, where the size of the city warranted, an additional 6 to 8 mile annulus was used.
U.S.S.R.
The most recent census of population available for the Soviet Union is that taken in 1939. Various agencies and individuals outside of Russia have estimated the population of cities and other subdivisions for post-war years. We used a variety of sources (*) and attempted to select the 50 largest cities (**).
[* - They were: Geography of the USSR, by Theodore Shabad (sometimes with revisions of estimates made concurrently by the author); U.S.A.F. Target Information Sheets; National Intelligence Survey No. 26.
** - Too late for consideration in this study, new estimates of the populations of all major Soviet cities have been completed (See Population of the Major Cities of the USSR, RM-815, by Theodore Shabad) which, had they been available sooner, would have caused selection of a somewhat different group of 50 urban areas and resulted in their being ordered differently, both by population and by casualties. It is not thought that over—all results would have been altered appreciably, however.]
Because it was necessary in distributing population to have maps, Karaganda, which is among the largest 50 cities, had to be eliminated (no map being available to us) and another city substituted.
To apportion the population, the limits of the area to which available population figures applied were first delineated on USAF Target Complex Charts. Within this area, distribution was made according to information in USAF Target Information Sheets. For boroughs and villages on the outskirts of the city and outside the delineated area (for which T.I.S. gave no data), it was assumed that average density was 70,000 people per square mile of floor space, and that floor space occupied 10 percent of the ground area overprinted in yellow on Target Complex Charts. Population was then attributed to these areas on the basis of planimeter measurements taken in square miles. Subsequently, we estimated the population living in the core and each annulus. In the case of Soviet cities the center of the core was selected visually as the center of the built-up area shown on the maps.
U.S.
It seemed to us that for the U.S. we should rely on the U.S. Census population figures for "urbanized areas." The Census defines an urbanized area so as to include the principal city plus the contiguous built-up areas including satellite cities and towns and unincorporated contiguous areas showing urban (or suburban) patterns of population density. (The "metropolitan area" as defined by the Census would have been less satisfactory for our use since this concept is defined on a county basis and often rural areas are included.)
We selected the largest 49 urbanized areas in the U.S. according to preliminary 1950 Census data, which includes all urbanized areas of 250,000 population or more. 55 major cities are included in these 49 areas, certain areas containing more than one major city, e.g., New York area, San Francisco, etc.
To distribute this population, we had, for over half of the urbanized areas considered (including 21 of the most populous), worksheets from Stanford Research Institute which give estimated 1950 population by 1000 yard squares. When these were not obtainable (or when they did not extend sufficiently far into the suburbs) it was necessary to resort to the larger divisions (e.g., townships, precincts) for which the 1950 U.S. Census of Population gives data accompanied by maps. On the whole, this was fairly satisfactory. At times, however, these units cover large areas and it was necessary to subdivide them, attributing part of the population to each division. Such attribution was accomplished under the assumption that population is evenly distributed over the entire unit, so that a given fraction of the unit area contains the same fraction of the unit population. Admittedly, this is at best a rough approximation; but it seemed satisfactory for our purposes.
On the basis of these estimates of population distribution, we estimated the numbers living in the core and annuli, in this case centered so as to maximize the total population included.
Estimation of Casualties
With the population distributed as described above, we assumed that the centers of the core and annuli in each case were the ground zero's and estimated maximum expected mortalities using percentages set forth in Appendix Table II (for Case 1, assuming CEP = 0).
In the case of Moscow in the Soviet Union, and New York, Los Angeles, Chicago, San Francisco, and Minneapolis—St. Paul in the U.S., it was discovered that the size of these urban centers indicated the assumption of 2 or more ground zero's, if we wished to estimate maximum possible mortalities. Accordingly, In these cases, the two or more points were chosen by inspection and the population distributed (in the same manner as in the single bomb cases) in a core and several annuli around each of these points, which were then assumed to be ground zero's.
Appendix Table III lists the 50 Soviet cities used in our computations and gives the population estimates on which we relied. Appendix Tables IV and V present the estimated mortalities for the 5-MT and 25-MT H-bombs for Case 1 (assuming no warning, no shelter) respectively, listed in order of estimated mortalities per bomb. The ordering differs slightly because variations in the distribution of population around the assumed ground zero's affects differently the results for the two weapons.
Table VI lists the 49 largest urbanized areas in the U.S. in order of population, and also the population and rank order for the principal cities around which these urban areas are centered, plus the comparable metropolitan area populations and rank. In addition, the populations estimated to be at risk within 6 miles of the assumed centers of the areas are presented.
Tables VII and VIII present the estimated mortalities for the U.S. in the same manner as the Soviet data is presented in Tables III and IV.
The same method was used in estimating mortalities for Case 2, where shelters are available.
Effect of CEP on Mortality Estimates
Consideration of the very large lethal radii used here, compared with the size of the cities examined, convinced us that allowance for CEP would not have a major impact on the mortalities estimated above, where we ignored this factor. We have checked this hypothesis by a method whose results are not precise but are accurate enough for the purpose at hand. In any case, the accuracy of the population distribution data is such that more detailed CEP calculations are not Justified. Our procedure was as follows: Representative targets were constructed for each country, each representing the average population distribution in a core and several annuli, and mortalities were computed assuming a 6,200—ft. CEP.
[We used a method suggested by M. Pelsakoff and based on H. H. Germond's RM-330, The Circular Coverage Function (Unclassified), and also relied on Germond's tables in carrying out the computations.]
This permitted us to compare average mortalities for all aiming points (each country, of course, considered separately) with zero CEP and with the assumed CEP. The following table summarizes the results, indicating the percentage of zero — CEP mortalities which would be expected with CEP = 6,200 feet, assuming no shelters.
|
Percentage of Zero CEP Mortalities if CEP = 6,200 feet |
||
|
Country |
5-MT Bomb |
25-MT Bomb |
|
U.S. |
90% |
95% |
|
U.S.S.R. |
92% |
96% |
|
APPENDIX
TABLE II |
|||||
|
CASE |
Bomb Size |
Distance from Ground Zero |
|||
|
0-2.5 mi. |
2.5-4 mi. |
4-6 mi. |
6-8 mi. |
||
|
Case 1 (*) |
5-MT |
95% |
80% |
25% |
— |
|
25-MT |
95% |
95% |
8o% |
50% |
|
|
Case 2 (**) |
5-MT |
85% |
50% |
10% |
— |
|
25-MT |
90% |
90% |
75% |
30% |
|
|
* Case 1 — assumes no shelter and no warning. ** Case 2 — assumes warning and conventional shelters but considerable post-attack mortality among those attempting to move from shelters as result of fire. |
|||||
|
APPENDIX
TABLE III [For Sources, see Appendix, p. 2.] |
||
|
# |
Urban Area |
Population (thousands) |
|
1. |
Moscow |
5,000 |
|
2. |
Leningrad |
3,200 |
|
3. |
Gorkiy |
900 |
|
4. |
Kharkov |
900 |
|
5. |
Kiev |
900 |
|
6. |
Baku |
862 |
|
7. |
Novosibirsk |
750 |
|
8. |
Odessa |
625 |
|
9. |
Tashkent |
594 |
|
10. |
Sverdlovsk |
550 |
|
11. |
Saratov |
550 |
|
12. |
Rostov |
550 |
|
13. |
Kuybyshev |
550 |
|
14. |
Tbilisi |
538 |
|
15. |
Riga |
530 |
|
16. |
Omsk |
525 |
|
17. |
Kazan |
525 |
|
18. |
Dnepropetrovsk |
525 |
|
19. |
Stalino |
500 |
|
20. |
Stalingrad |
450 |
|
21. |
Molotov |
450 |
|
22. |
Chelyabinsk |
450 |
|
23. |
Lvov |
425 |
|
24. |
Voronezh |
350 |
|
25. |
Ufa |
350 |
|
26. |
Zaporozhye |
325 |
|
27. |
Yaroslavl |
325 |
|
28. |
Vladivostok |
325 |
|
29. |
Krasnoyarsk |
325 |
|
30. |
Khabarovsk |
325 |
|
31. |
Ivanovo |
325 |
|
32. |
Irkutsk |
325 |
|
33. |
Astrakhan |
325 |
|
34. |
Arkganelsk |
325 |
|
35. |
Yerevan |
315 |
|
36. |
Minsk |
301 |
|
37. |
Tula |
300 |
|
38. |
Makeyeuka |
275 |
|
39. |
Voroshilovgrad |
250 |
|
40. |
Krivoy Rog |
250 |
|
41. |
Kalinin |
250 |
|
42. |
Alma Ata |
243 |
|
43. |
Izhevsk |
225 |
|
44. |
Kaliningrad |
225 |
|
45. |
Krasnodar |
225 |
|
46. |
Zhdanov |
225 |
|
47. |
Chkalov |
225 |
|
48. |
Vilnyus |
195 |
|
49 |
Taganrog |
175 |
|
50. |
Groznyy |
175 |
|
APPENDIX TABLE IV |
|||
|
Rank |
Urban Area |
Mortalities |
Accum. Total* |
|
1. |
Moscow No. 1 |
2.2 |
2.2 |
|
2. |
Leningrad |
1.8 |
4.0 |
|
3- |
Moscow No. 2 |
1.3 |
5.3 |
|
4. |
Kharkov |
0.8 |
6.1 |
|
5- |
Baku |
0.8 |
6.9 |
|
6. |
Kiev |
0.7 |
7.6 |
|
7- |
Gorkiy |
0.7 |
8.3 |
|
8. |
Novosibirsk |
0.7 |
9.0 |
|
9. |
Dnepropetrovsk |
0.5 |
9.5 |
|
10. |
Sverdlovsk |
0.5 |
10.0 |
|
11. |
Tashkent |
0.5 |
10.5 |
|
12. |
Odessa |
0.5 |
11.1 |
|
13- |
Rostov |
0.5 |
11.5 |
|
14. |
Tbilisi |
0.5 |
12.0 |
|
15. |
Chelyabinsk |
0.5 |
12.5 |
|
16. |
Omsk |
0.5 |
13.0 |
|
17. |
Saratov |
0.5 |
13.4 |
|
18, |
Molotov |
0.5 |
13.9 |
|
19. |
Kuybyshev |
0.4 |
14.3 |
|
20, |
Kazan |
0.4 |
14.7 |
|
21 |
Lvov |
0.4 |
15.1 |
|
22 |
Stalino |
0.4 |
15.5 |
|
23 |
Riga |
0.4 |
15.9 |
|
24 |
Voronezh |
0.3 |
16.2 |
|
25 |
Stalingrad |
0.3 |
16.5 |
|
26 |
Ufa |
0.3 |
16.8 |
|
27- |
Arkangelsk |
0.3 |
17.0 |
|
28. |
Krasnoyarsk |
0.3 |
17.3 |
|
29- |
Makeyevka |
0.3 |
17.6 |
|
30. |
Ivanovo |
0.3 |
17.9 |
|
31- |
Astrakhan |
0.3 |
18.2 |
|
32. |
Kalinin |
0.3 |
18.4 |
|
33- |
Vladivostok |
0.3 |
18.7 |
|
34. |
Zaporozhye |
0.3 |
19.0 |
|
35- |
Tula |
0.3 |
19.3 |
|
36. |
Yaroslavl |
0.3 |
19.5 |
|
37- |
Irkutsk |
0.3 |
19.8 |
|
38. |
Khabarovsk |
0.3 |
20.1 |
|
39- |
Yerevan |
0.2 |
20.3 |
|
40. |
Alma Ata |
0.2 |
20.5 |
|
41. |
Krasnodar |
0.2 |
20-8 |
|
42. |
Minsk |
0.2 |
21.0 |
|
43- |
Vilnyus |
0.2 |
21.2 |
|
44. |
Chkalov |
0.2 |
21.4 |
|
45. |
Izhevsk |
0.2 |
21.6 |
|
46. |
Voroshilovgrad |
0.2 |
21.8 |
|
47- |
Grosnyy |
0.2 |
21.9 |
|
48. |
Krivoy Rog |
0.2 |
22.1 |
|
49- |
Zhdanov |
0.2 |
22.3 |
|
50. |
Taganrog |
0.1 |
22.4 |
|
51. |
Kaliningrad |
0.1 |
22.6 |
|
* Accumulated totals have been rounded independently. |
|||
|
APPENDIX TABLE V |
|||
|
Rank |
Urban Area |
Mortalities |
Accum. Total* |
|
1. |
Moscow No. 1 |
2.7 |
2.7 |
|
2. |
Leningrad |
2.3 |
4.9 |
|
3. |
Moscow No. 2 |
1.8 |
6.7 |
|
4. |
Gorkiyy |
0.9 |
7.6 |
|
5- |
Kharkov |
0.9 |
8.4 |
|
6. |
Kiev |
0.8 |
9.3 |
|
7. |
Baku |
0.8 |
10.1 |
|
8. |
Novosibirsk |
0.7 |
10.8 |
|
9. |
Tashkent |
0.6 |
11.4 |
|
10. |
Sverdlovsk |
0.6 |
12.0 |
|
11. |
Dnepropetrovsk |
0.6 |
12.5 |
|
12. |
Kyubyshev |
0.6 |
13.1 |
|
13. |
Odessa |
0.6 |
13.6 |
|
14. |
Tbilisi |
0.5 |
14.1 |
|
15. |
Rostov |
0.5 |
14.7 |
|
16. |
Saratov |
0.5 |
15.1 |
|
17 |
Chelyabinek |
0.5 |
15.6 |
|
18. |
Stalino |
0.5 |
16.1 |
|
19. |
Omsk |
0.5 |
16.6 |
|
20. |
Molotov |
0.5 |
17.1 |
|
21. |
Lvov |
0.4 |
17.5 |
|
22. |
Kazan |
0.4 |
17.9 |
|
23 |
Riga |
0.4 |
18.3 |
|
24. |
Stalingrad |
0.3 |
18.7 |
|
25. |
Voronezh |
0.3 |
19.0 |
|
26. |
Arkangelsk |
0.3 |
19.3 |
|
27. |
Ufa |
0.3 |
19.6 |
|
28. |
Krasnoyarsk |
0.3 |
19.9 |
|
29. |
Zaporozhye |
0.3 |
20.2 |
|
30. |
Astrakhan |
0.3 |
20.5 |
|
31. |
Irkutsk |
0.3 |
20.8 |
|
32. |
Makeyevka |
0.3 |
21.0 |
|
33 |
Kalinin |
0.3 |
21.3 |
|
34. |
Ivanovo |
0.3 |
21.6 |
|
35. |
Vladivostok |
0.3 |
21.9 |
|
36. |
Yaroslavl |
0.3 |
92.2 |
|
37. |
Tula |
0.3 |
22.5 |
|
38. |
Khabarovsk |
0.3 |
22.7 |
|
39. |
Yerevan |
0.3 |
23.0 |
|
40. |
Alma Ata |
0.2 |
23.2 |
|
41. |
Krasnodar |
0.2 |
23.5 |
|
42. |
Minsk |
0.2 |
23.7 |
|
43. |
Zhadanov |
0.2 |
23.9 |
|
44. |
Voroshilovgrad |
0.2 |
24.1 |
|
45. |
Vilnyus |
0.2 |
24.3 |
|
46. |
Izhevsk |
0.2 |
24.5 |
|
47. |
Chkalov |
0.2 |
24.7 |
|
48. |
Krivoy Rog |
0.2 |
24.9 |
|
49. |
Groznyy |
0.2 |
25.0 |
|
50. |
Taganrog |
0.1 |
25.2 |
|
51. |
Kaliningrad |
0.1 |
25.3 |
|
* Accumulated totals rounded independently. |
|||
|
APPENDIX
TABLE VI |
|||||||
|
Urbanized Area |
Population Urban Area |
Rank |
Population Principal City |
Rank |
Population Standard Metro Area |
Rank |
Estimated Population in 6 mi. radius |
|
New York -New Jersey |
12,296 |
1 |
7,892 |
1 |
12,832 |
1 |
* |
|
Chicago |
4,921 |
2 |
3,621 |
2 |
5,476 |
2 |
* |
|
Los Angeles |
3,997 |
3 |
1,970 |
|
4,339 |
3 |
* |
|
Philadelphia |
2,922 |
4 |
2,072 |
3 |
3,661 |
4 |
2,009 |
|
Detroit |
2,659 |
5 |
1,850 |
5 |
2,973 |
5 |
1,298 |
|
Boston |
2,233 |
6 |
801 |
10 |
2,355 |
6 |
921 |
|
San Francisco — Oakland |
2,022 |
7 |
775 |
11 |
2,214 |
7 |
* |
|
Pittsburgh |
1,533 |
8 |
677 |
12 |
2,206 |
8 |
917 |
|
St. Louis |
1,400 |
9 |
857 |
8 |
1,673 |
9 |
1,041 |
|
Cleveland |
1,384 |
10 |
915 |
7 |
1,454 |
11 |
631 |
|
Washington |
1,287 |
11 |
802 |
9 |
1,458 |
10 |
880 |
|
Baltimore |
1,162 |
12 |
950 |
6 |
1,321 |
12 |
788 |
|
Minneapolis — St. Paul |
985 |
13 |
522 |
17 |
1,107 |
13 |
* |
|
Milwaukee |
829 |
14 |
637 |
13 |
864 |
16 |
698 |
|
Cincinnati |
813 |
15 |
504 |
18 |
898 |
15 |
626 |
|
Buffalo |
793 |
16 |
580 |
15 |
1,086 |
14 |
731 |
|
Kansas City |
698 |
17 |
457 |
20 |
808 |
17 |
664 |
|
Houston |
697 |
18 |
594 |
14 |
802 |
18 |
534 |
|
Rev Orleans |
660 |
19 |
570 |
16 |
681 |
22 |
615 |
|
Seattle |
622 |
20 |
468 |
19 |
726 |
20 |
329 |
|
Providence |
551 |
21 |
249 |
37 |
733 |
19 |
370 |
|
Dallas |
537 |
22 |
433 |
21 |
611 |
24 |
335 |
|
Portland |
513 |
23 |
374 |
27 |
701 |
21 |
391 |
|
Atlanta |
508 |
24 |
331 |
31 |
664 |
23 |
425 |
|
Indianpolis |
502 |
25 |
427 |
22 |
549 |
28 |
442 |
|
Denver |
499 |
26 |
416 |
23 |
560 |
26 |
425 |
|
Louisville |
473 |
27 |
369 |
28 |
574 |
25 |
358 |
|
Miami |
459 |
28 |
249 |
38 |
489 |
34 |
255 |
|
San Antonio |
447 |
29 |
407 |
24 |
496 |
33 |
295 |
|
Birmingham |
445 |
30 |
326 |
32 |
554 |
27 |
300 |
|
Columbus |
435 |
31 |
376 |
26 |
502 |
32 |
350 |
|
San Diego |
433 |
32 |
334 |
29 |
536 |
29 |
280 |
|
Rochester (N.Y.) |
409 |
33 |
332 |
30 |
485 |
35 |
339 |
|
Memphis (Tenn.) |
4o6 |
34 |
396 |
25 |
480 |
36 |
325 |
|
Norfolk-Portsmouth |
385 |
35 |
214 |
43 |
410 |
38 |
363 |
|
Akron |
367 |
36 |
275 |
35 |
408 |
39 |
320 |
|
Toledo |
364 |
37 |
304 |
33 |
393 |
41 |
307 |
|
Springfield-Holyoke |
357 |
38 |
162 |
47 |
407 |
40 |
276 |
|
Dayton |
347 |
39 |
244 |
39 |
453 |
37 |
309 |
|
Fort Worth |
314 |
40 |
277 |
34 |
359 |
44 |
265 |
|
Dayton |
310 |
41 |
251 |
36 |
362 |
43 |
290 |
|
Hartford |
301 |
42 |
177 |
44 |
356 |
45 |
273 |
|
Youngstown |
298 |
43 |
168 |
46 |
527 |
30 |
217 |
|
Albany—Troy |
292 |
44 |
135 |
48 |
513 |
31 |
200 |
|
Oklahoma City |
275 |
45 |
244 |
4o |
323 |
48 |
257 |
|
Wilkes—Barre |
272 |
46 |
77 |
49 |
391 |
42 |
171 |
|
Syracuse |
265 |
47 |
221 |
42 |
341 |
46 |
262 |
|
Nashville |
259 |
48 |
174 |
45 |
320 |
49 |
240 |
|
Richmond |
258 |
49 |
230 |
41 |
327 |
47 |
250 |
|
|
55,199 |
|
35,686 |
|
|
|
36,710 * |
|
* Data not derived for single radius origins in multiple ground zero cities; total includes population within 6 miles of all ground zeros. Source: U. S. Department of Commerce 1950 Population Census, Vol. II, Characteristics of the Population (Washington: Gov't Printing Office, 1952). |
|||||||
|
APPENDIX TABLE VII |
|||
|
Rank |
Urbanized Area |
Mortalities |
Accum. Total |
|
1. |
New York (Bronx) |
1.9 |
1.9 |
|
2. |
New York (B'klyn) |
1.5 |
3.4 |
|
3- |
Chicago (Northern) |
1.2 |
4.7 |
|
4. |
Philadelphia |
1.1 |
5.7 |
|
5. |
Chicago (Southern) |
0.9 |
6.6 |
|
6. |
New York (Newark) |
0.8 |
7.4 |
|
7- |
Boston |
0.7 |
8.1 |
|
8. |
Detroit |
0.7 |
8.8 |
|
9. |
Baltimore |
0.6 |
9.4 |
|
10. |
Washington |
0.6 |
10.0 |
|
11. |
St. Louis |
0.6 |
10.6 |
|
12. |
San Francisco — Oakland (SF) |
0.6 |
11.1 |
|
13- |
Milwaukee |
0.6 |
11.7 |
|
14. |
Buffalo |
0.5 |
12.2 |
|
15. |
Pittsburgh |
0.5 |
12.8 |
|
16. |
Cleveland |
0.5 |
13.2 |
|
17- |
Minneapolis St. Paul (Minn.) |
0.5 |
13.7 |
|
18. |
Kansas City |
0.4 |
14.1 |
|
19- |
New Orleans |
0.4 |
14.5 |
|
20. |
Cincinnati |
0.4 |
14.9 |
|
21. |
Los Angeles (No. 1) |
0.4 |
15.3 |
|
22. |
Houston |
0.3 |
15.6 |
|
23- |
Denver |
0.3 |
l6.0 |
|
24. |
Indianapolis |
0.3 |
16.3 |
|
25. |
Atlanta |
0.3 |
16.6 |
|
26. |
San Francisco — Oakland (Oak) |
0.3 |
16.9 |
|
27- |
Louisville |
0.3 |
17.3 |
|
28. |
Los Angeles (No.2) |
0.3 |
17.5 |
|
29- |
Portland |
0.3 |
17.8 |
|
30. |
Providence |
0.3 |
18.1 |
|
31. |
Rochester |
0.3 |
18.4 |
|
32. |
Memphis |
0.3 |
18.7 |
|
33. |
Akron |
0.3 |
18.9 |
|
34. |
Norfolk-Portsmouth |
0.2 |
19.2 |
|
35. |
Dayton |
0.2 |
19.4 |
|
36. |
Columbus |
0.2 |
19.7 |
|
37. |
Birmingham |
0.2 |
19.9 |
|
38. |
Hartford |
0.2 |
20.1 |
|
39. |
Syracuse |
0.2 |
20.4 |
|
4o. |
Toledo |
0.2 |
20.6 |
|
41. |
Seattle |
0.2 |
20.8 |
|
42. |
San Antonio |
0.2 |
21.0 |
|
43- |
Omaha |
0.2 |
21.3 |
|
44. |
Minneapolis—St .Paul (St. Paul) |
0.2 |
21.5 |
|
45. |
Richmond |
0.2 |
21.7 |
|
46. |
Los Angeles (No. 3) |
0.2 |
21.9 |
|
47. |
San Diego |
0.2 |
22.1 |
|
48. |
Dallas |
0.2 |
22.3 |
|
49. |
Oklahoma City |
0.2 |
22.4 |
|
50. |
Springfield, Holyoke |
0.2 |
22.6 |
|
51. |
Miami |
0.2 |
22.8 |
|
52. |
Fort Worth |
0.2 |
23.0 |
|
53. |
Youngstown |
0.2 |
23.2 |
|
54. |
Nashville |
0.2 |
23.3 |
|
55. |
Albany-Troy |
0.2 |
23.5 |
|
56. |
Wilkes-Barre |
0.1 |
23.6 |
|
APPENDIX TABLE VIII |
|||
|
Rank |
Urbanized Area |
Mortalities |
Accum. Total* |
|
1. |
New York (Bronx) |
3.5 |
3.5 |
|
2. |
New York (B'klyn) |
3.1 |
6.6 |
|
3- |
Chicago (Northern) |
2.1 |
8.7 |
|
4. |
Philadelphia |
1.9 |
10.6 |
|
5- |
Detroit |
1.3 |
11.9 |
|
6. |
Chicago (Southern) |
1.3 |
13.2 |
|
7. |
Nev York (Newark) |
1.0 |
14.2 |
|
8. |
Boston |
1.0 |
15.2 |
|
9. |
St. Louis |
1.0 |
16.1 |
|
10. |
Pittsburgh |
0.9 |
17.0 |
|
11. |
Los Angeles (No. 1) |
0.8 |
17.8 |
|
12. |
Washington |
0.8 |
18.6 |
|
13. |
Baltimore |
0.8 |
19.4 |
|
14. |
San Francisco-Oakland (SF) |
0.7 |
20.1 |
|
15. |
Los Angeles (No. 2) |
0.7 |
20.9 |
|
16. |
Cleveland |
0.7 |
21.5 |
|
17. |
Buffalo |
0.7 |
22.2 |
|
18. |
Milwaukee |
0.7 |
22.9 |
|
19- |
Kansas City |
0.6 |
23.5 |
|
20. |
Cincinnati |
0.6 |
24.0 |
|
21. |
Minneapolis— St. Paul (Minn) |
0.6 |
24.6 |
|
22. |
New Orleans |
0.6 |
25.2 |
|
23- |
San Francisco-Oakland (Oak) |
0.5 |
25.6 |
|
24. |
Houston |
0.5 |
26.1 |
|
25. |
Los Angeles (No. 3) |
0.4 |
26.6 |
|
26. |
Indianapolis |
0.4 |
27.0 |
|
27- |
Atlanta |
0.4 |
27.4 |
|
28. |
Denver |
0.4 |
27.8 |
|
29- |
Portland |
0.4 |
28.2 |
|
30. |
Providence |
0.4 |
28.6 |
|
31- |
Seattle |
0.3 |
28.9 |
|
32. |
Louisville |
0.3 |
29.2 |
|
33. |
Norfolk-Portsmouth |
0.3 |
29.6 |
|
34. |
Rochester |
0.3 |
29.9 |
|
35- |
Columbus |
0.3 |
30.2 |
|
36. |
Memphis |
0.3 |
30.5 |
|
37- |
Akron |
0.3 |
30.8 |
|
38. |
Dallas |
0.3 |
31.1 |
|
39- |
Dayton |
0.3 |
31.4 |
|
40. |
Birmingham |
0.3 |
31.7 |
|
41. |
Toledo |
0.3 |
31.9 |
|
42. |
Minneapolis— St. Paul (St.P.) |
0.3 |
32.2 |
|
43- |
San Antonio |
0.3 |
32.5 |
|
44. |
Omaha |
0.3 |
32.8 |
|
45- |
Hartford |
0.3 |
33.0 |
|
46. |
San Diego |
0.3 |
33.3 |
|
47. |
Springfield-Holyoke |
0.2 |
33.5 |
|
48. |
Syracuse |
0.2 |
34.3 |
|
49- |
Fort Worth |
0.2 |
34.0 |
|
50. |
Oklahoma City |
0.2 |
34.3 |
|
51. |
Richmond |
0.2 |
34.5 |
|
52. |
Miami |
0.2 |
34.7 |
|
53- |
Nashville |
0.2 |
34.9 |
|
54. |
Youngstown |
0.2 |
35.2 |
|
55. |
Albany-Troy |
0.2 |
35.3 |
|
56. |
Wilkes—Barre |
0.2 |
35.5 |
|
* Accumulated totals have been rounded independently. |
|||