Fig. 1 – EFFECTS OF A 5 MT BLAST
If burst is elevated to altitude maximizing reach of blast
damage: |
|
DOCUMENT RESUME ED 026 841 By Romm, Joseph A brief history of civil defense administration precedes analysis of nuclear attack conditions and the influence of protective measures. Damage limitation procedure is explained in terms of – (1) blast effects, (2) radiation doses, (3) geographical fallout distribution patterns, and (4) national shelter needs. Major concept emphasis relates to--(1) lifesaving potential of improved strategic defense programs, (2) functional protection factor determination for shelters, and (3) geographic and demographic characteristics of hypothetical attack situations. Extensive substantive data and diagrams are included. (MH) |
TR 35
|
BACKGROUND OF CIVIL DEFENSE AND CURRENT DAMAGE LIMITING STUDIES |
|
U.S. DEPARTMENT OF HEALTH, EDUCATION &
WELFARE THIS DOCUMENT HAS BEEN REPRODUCED EXACTLY AS WHIN FROM THE PERSON OR ORGANIZATION ORIGINATING IT. POINTS OF VIEW OR OPINIONS STATED DO NOT NECESSARILY REPRESENT OFFICIAL OFFICE OF EDUCATION POSITION OR POLICY. DEPARTMENT OF DEFENSE
|
This is a reprint of a speech by Mr. Romm before the 1965 Convention of "State School Plant Planning Officials" in Lincoln, Nebraska, October 4-5, 1965.
Let me tell you some of the history of the civil defense to which reference was made earlier. I d like to go over some of the recent history with you; as a lead in to what we have, how we do business these days in the Defense Department, and also try to give you an idea of the change in civil defense. I can speak pretty unemotionally about this because I didn’t get involved in it until four years ago when I was transferred to the Office of Civil Defense from the Department of Defense.
The change in civil defense runs something like this. First, in the Department of Defense we have a tremendous availability of manpower and assets and know-how to apply to programs. You find that throughout our program military capabilities have been injected everywhere they can give us the most for our invested dollar. Military engineers are the people who administer the fallout shelter survey. The survey was designed and is managed in the Office of Civil Defense; but, it is performed in the field by military department engineers. The same is true for our continuing and expanded survey; all of which I’m sure you’ll be brought up to date on during your meetings.
The Defense Supply Agency developed our shelter supplies program. This includes specifications, procurements, warehousing and distribution. These are done in the same fashion that military stocks are controlled, stored, and issued. The same control systems are applied, even though ours is the biggest retail supply system in the Department of Defense.
The Defense Communications Agency has integrated civil defense communications into military communications. OCD is the beneficiary of a communications system with all the flexibility, redundancy, and the protected lengths that are available to the military. These are the three big pieces of immediate professional military support.
Some other capable supports being provided are: payrolls handled by the Army Finance and Accounts Office, publications distributed by the Adjutant General’s Office, the film libraries of the Army Audio-Visual Communication Center provide local distribution of our films. A tremendous capability has been made available to civil defense.
That’s the first big difference. I think this has led also to increased professionalism within the civil defense structure itself; at our level—the Federal level, at the state level and particularly at the local level where we match funds for their salaries and administrative costs. We haven’t kept accurate records, but since this was begun in 1960-61, there have been approximately a two-thirds turn-over in personnel at the local level. All of the new employees were required to qualify under the merit systems of their states and cities. So it had to attract better people; more talented and more professional.
From my viewpoint, the biggest single difference in the program is integration of civil defense planning with military planning. In the past four years, civil defense decisions, program direction and accomplishment, all have been subjected to the kind of studies that go on in the Pentagon and to the same kind of meat grinder analysis and evaluation that all Department of Defense weapons systems are subjected to. We must compete with every other weapons system. We fight and scratch for the same defense dollar. We have, I think, fared fairly well internally. The military understands our weapons system and we’re treated as a weapons system. The decision-makers in the Pentagon look to us for the same cost effectiveness and damage limiting analysis as any other component of the Department of Defense. This keeps us honest and it’s good for the program.
What I have here—I don’t know how many of you have been exposed to this—but, basically it’s the simple build-up and logical steps from a nuclear detonation to the why of the kind of program we propose. Since this is a small enough group, and I have a limited amount of time, I’d like you to raise questions as we go along. I thing this will be just as well as saving them until the end. And, since I talk off-the cuff, I’m likely to miss a point and the questions will help me remember it.
This set of figures is one of the few sets that we have gotten cleared out of all these classified damage limiting studies, I mentioned before. I think they make the point we want to make extremely well. They are extracted from two separate damage limiting studies. We do a damage limiting study each year at the direction of the Secretary of Defense. This year’s will be completed by the end of the month. The conclusions remain the same; however, we get more and more precise in the way we do them. But the general conclusion I will cover here holds this year and as you’ll see, will hold for many years to come.
Damage limiting is very precise terminology. It’s not damage denial. This program doesn’t protect everybody from getting hurt and it doesn’t deny the enemy the ability to kill a lot of people. What it does is to limit his capability to damage us. And this is all any defense program can do. This program is part and parcel of the total strategic defense posture of our country. It is included in Secretary McNamara’s programs as part of the strategic defense.
I’d like to take you through the sequence of charts. I think it will be useful for those of you who have to present the value of civil defense back home. I think you will find this sequence a good approach. We use it with the public, with the Congress, and with technical groups.
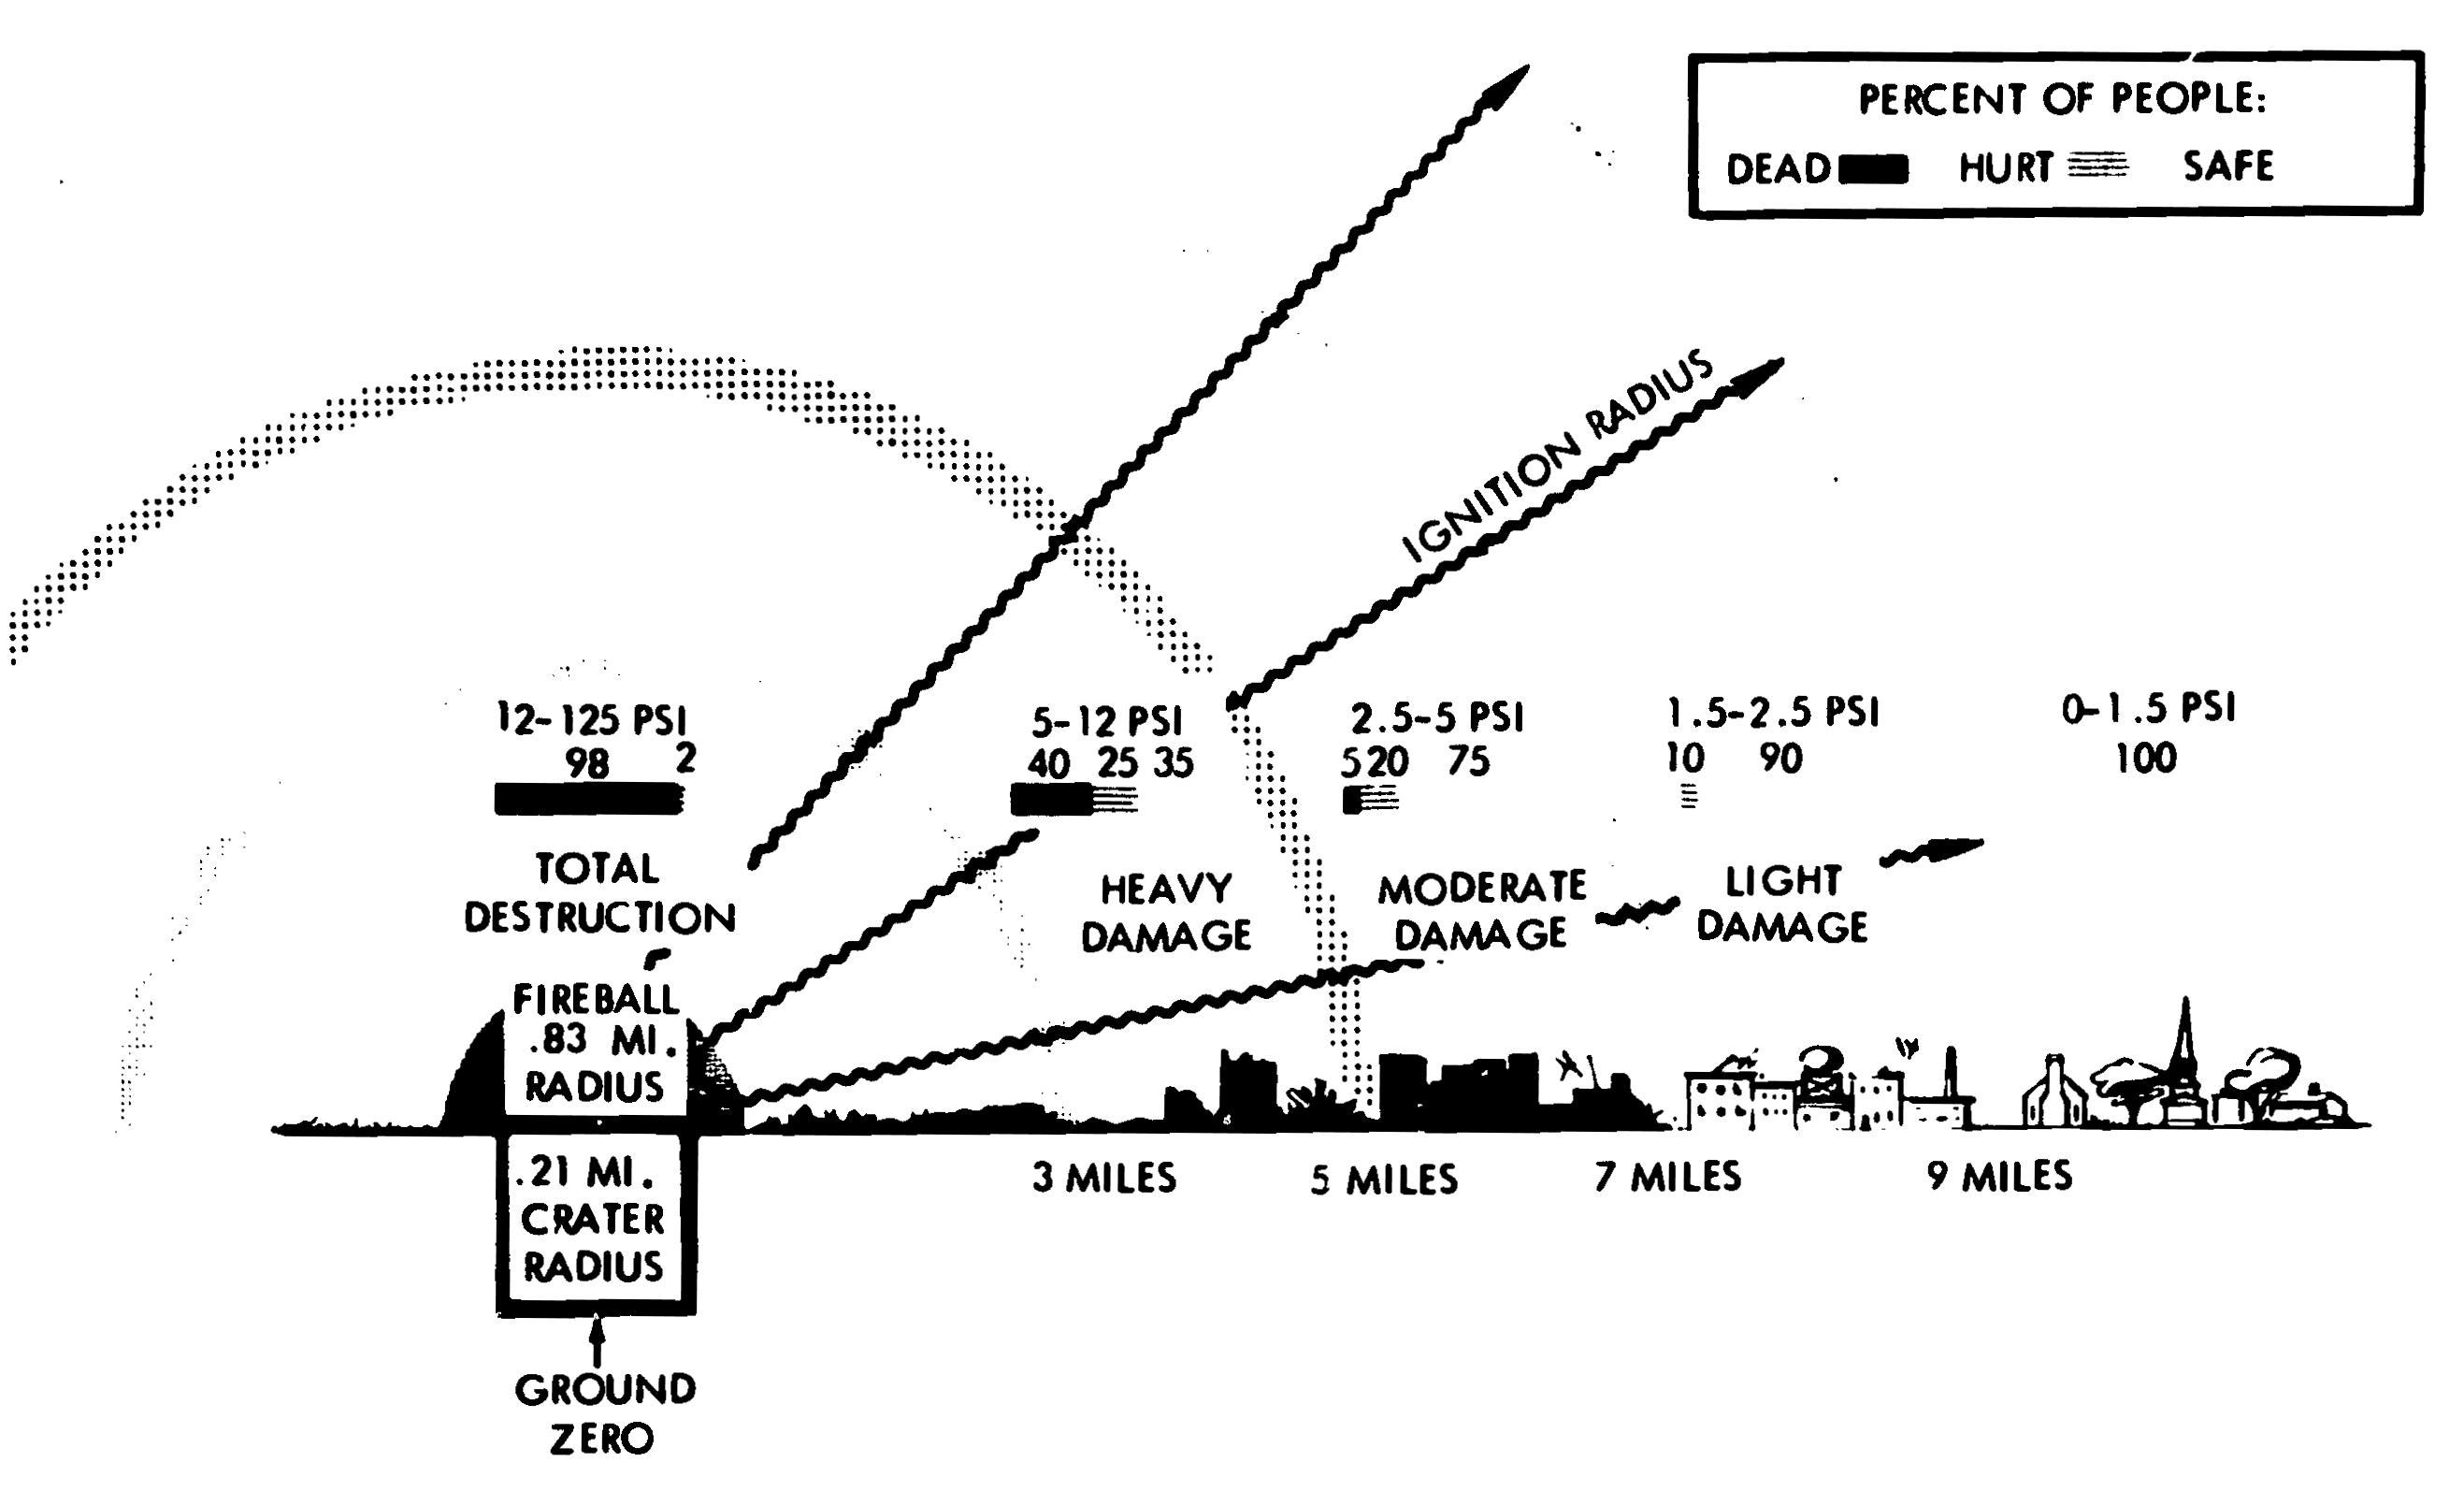
Figure 1 indicates possible blast and thermal effects produced by a five megaton blast at or near the surface.
Fig. 1 – EFFECTS OF A 5 MT BLAST
If burst is elevated to altitude maximizing reach of blast
damage: |
I’d like to make several points with this. First, a five megaton blast is a pretty good measure of enemy capabilities. The point I want to make is shown on the horizontal bar broken up in three parts by percentages. The darkest part on your left is percent dead—the next one is injured but alive—and the blue over to the right is uninjured. Recognize that from ground zero to three miles out almost everyone is dead with this weapon. We don’t claim they’re going to survive. But, beyond this three mile zone, there are substantial numbers of survivors—60 percent between 3 and 5 miles; and 95 percent between 5 and 7 miles. Beyond that everyone survives the blast effect.
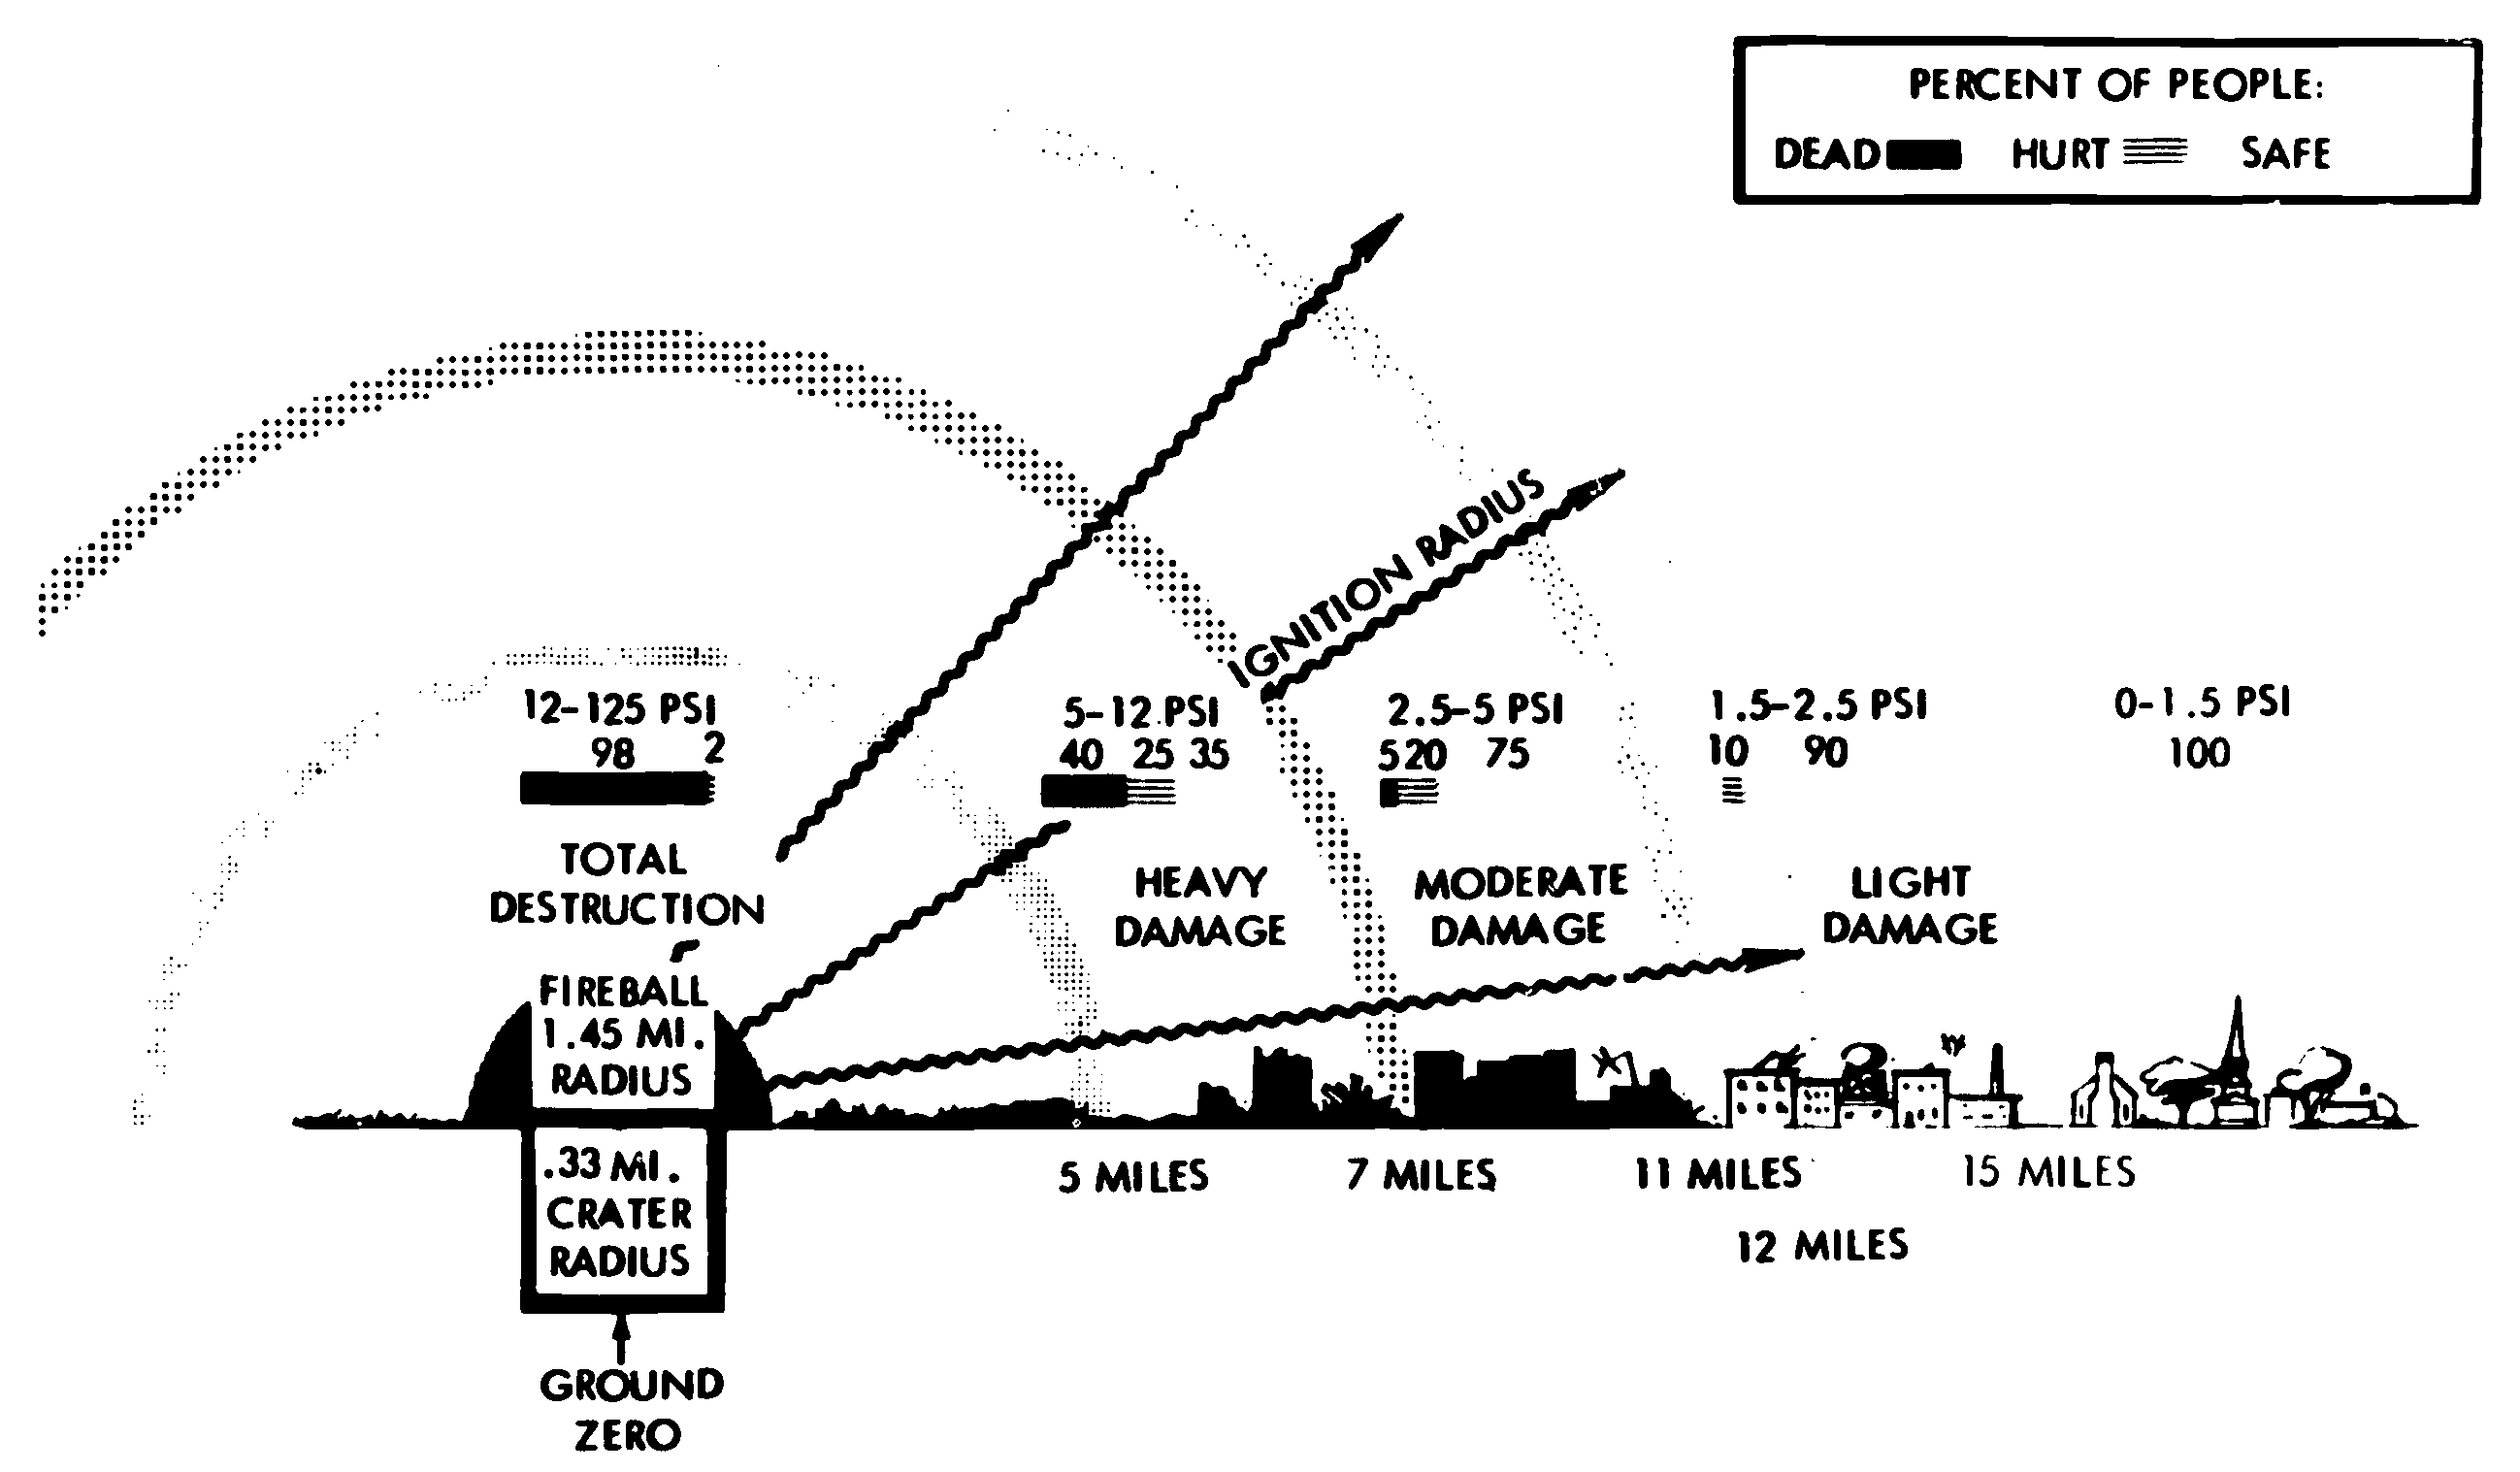
The point is, that those who survive the blast are still in need of a considerable amount of protection if they are to continue to survive. Now, we’ve been criticized many times for using a five megaton weapon as the nominal weapon; so, on the next chart (Figure 1a), is a twenty megaton weapon.
Fig. 1a – EFFECTS OF A 20 MT BLAST
If burst is elevated to altitude maximizing reach of blast damage: "Moderate Damage" from blast is extended from 11 to 17 miles "Ignition Radius" (ignites newspaper) is extended from 15 to 17 miles |
This makes the same point. That distances from ground zero increase only by about two miles for the same levels of damage to people. A four-fold increase in weapons megatonnage does not increase proportionately the effects on people. This is a well known attribute of nuclear weapons—that their damage is proportionate to the cube root of the distance from the weapon. In other words, if someone could deliver a twenty megaton yield, he’d do a lot more damage with four five megaton weapons than one twenty megaton weapon.
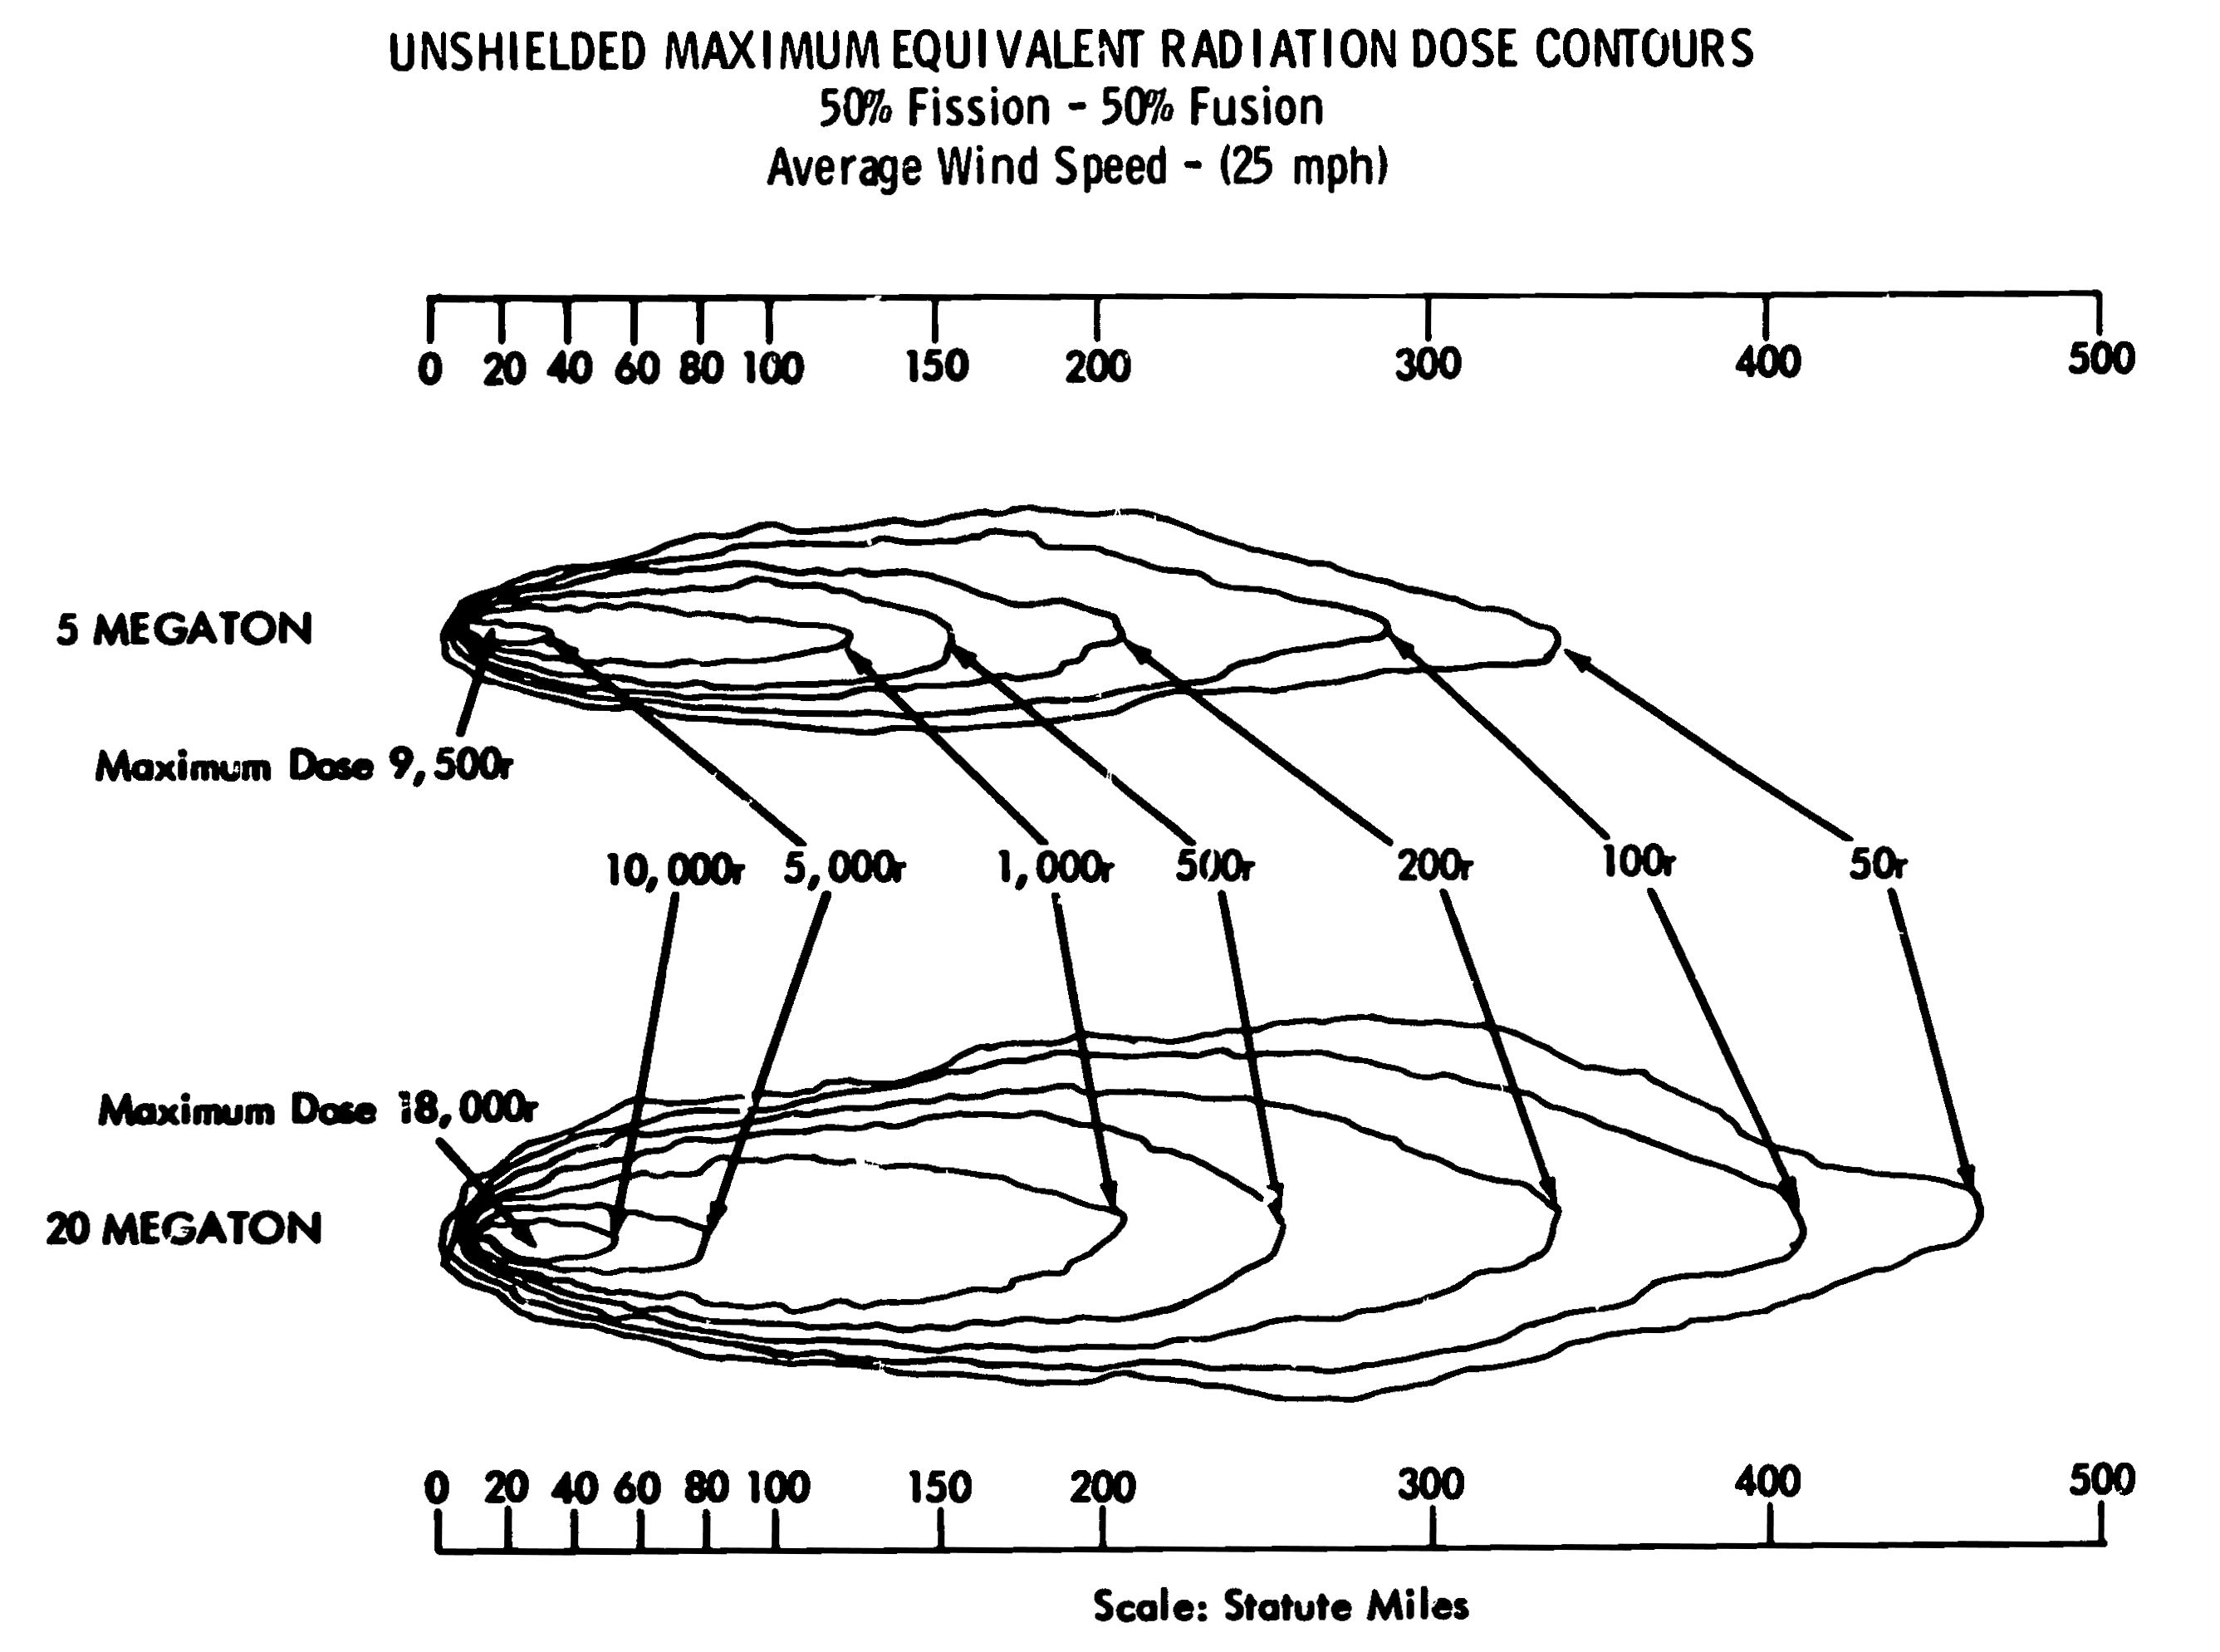
Blast is not the only problem. Figure 2 shows the stylized downwind fallout contours that could occur with the same two weapons detonated on the ground.
Fig. 2 – UNSHIELDED MAXIMUM EQUIVALENT
RADIATION DOSE CONTOURS
|
This assumes a fifty percent fission yield which results in radioactive particles. With an average upper atmosphere wind of twenty-five miles per hour, the area covered with a five megaton weapon is 350 miles downwind and about 75 miles across at the widest point. With a twenty megaton weapon it is 450 miles downwind and about 150 miles across at the widest point. Now, I’d like to deal with the fallout contours themselves. We show them from the very hottest parts down to 50 roentgens per hour. I will put this in some sort of context by telling you it is based on a whole series of non-empirical argumentations by doctors who have had very little experience. The only real weapons that went off were at Hiroshima and Nagasaki and very little is known about body dose, body recovery, instantaneous doses, short-term doses, and long-term doses. On the figures I’m about to give you, the doctors somehow or other reached agreement.
They feel 450 roentgens will cause death to about 50 percent of the average healthy exposed humans. The 100 percent killing dose is estimated at various levels between 650 and 800 roentgens. Nobody survives a 1,000 roentgens dose. There probably will be no fatalities at 200 roentgens per hour. Probably no fatalities but this is the entering point where there will be disabling injuries. Practically anyone who gets as much as 200 roentgens will be sick to the point where he won’t be able to do a job.
Below 200 roentgens, they may be ill but they’re still effective and below 50 roentgens, probably won’t cause any injury. Now the reason I showed the contours beyond 200 roentgens is to make this point. In an attack you won’t get one weapon. There will be many detonated and the dose contours would be additive. It doesn’t take very many 100 roentgens or 50 roentgens contours to add up to disabling and fatal doses.
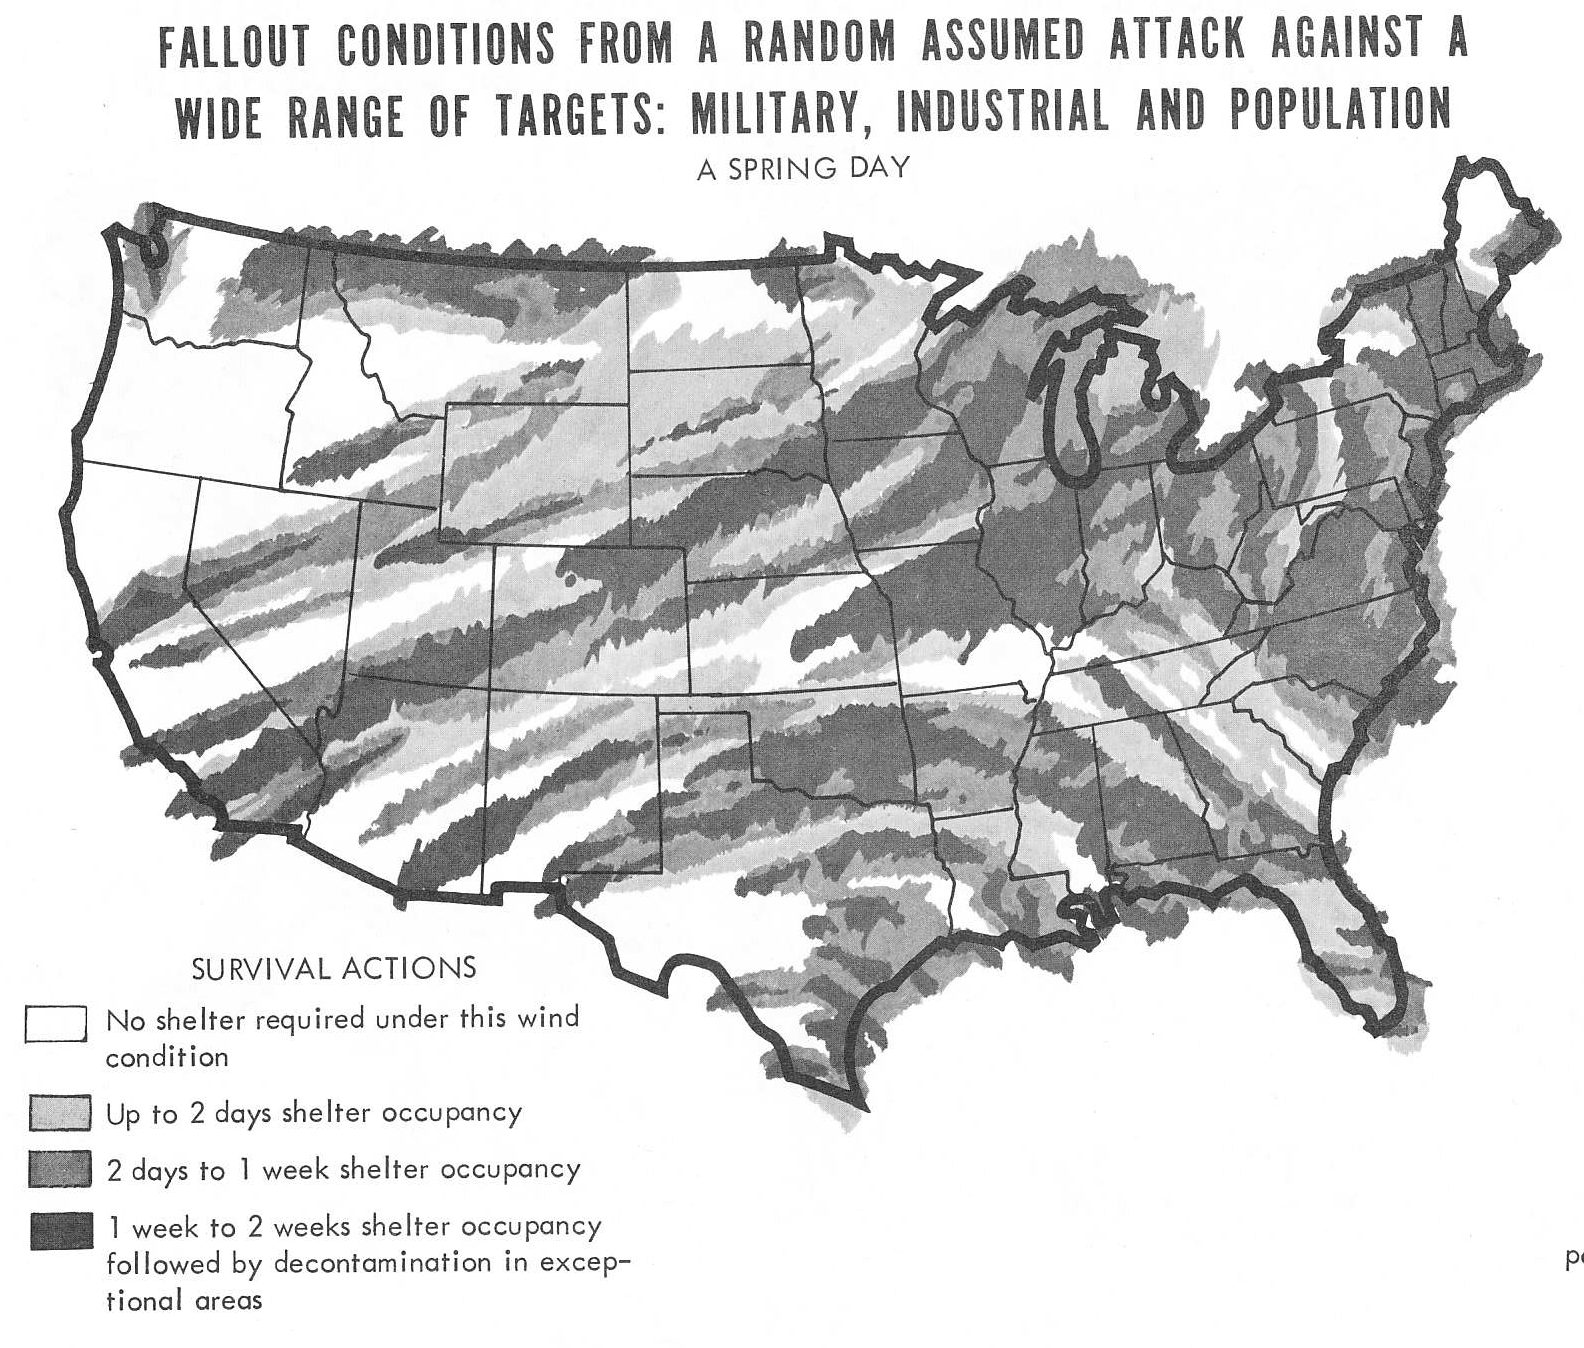
Figure 3 shows such an attack.
Fig. 3 – FALLOUT CONDITIONS FROM A RANDOM ASSUMED ATTACK AGAINST A WIDE RANGE OF TARGETS: MILITARY, INDUSTRIAL, AND POPULATION – A SPRING DAY
|
This was a gamed attack, designed by a military war games group. It was one of very many. There were 100 attacks gamed in this particular study. This one had everything targeted: military targets, urban-industrial targets, and population targets. Actually, 5500 megatons were delivered on the continental U.S., with two-thirds of it detonated on the ground. The fallout contours you see result from the specific winds of a spring day. The color differences are indications of the intensity of the fallout which affects the length of time people would have to stay in shelter. In the white areas no shelter would be required—in this particular attack those areas would be exempt; in the yellow, people would be required to take shelter for up to two days; and in the orange two days to a a week; and in the red a week to two weeks. In the very hot spots in the red, they might have to stay there a little longer, or decontaminate, or leave the area, or occupy shelters part-time after the two week period—that is, work some, stay in shelter some.
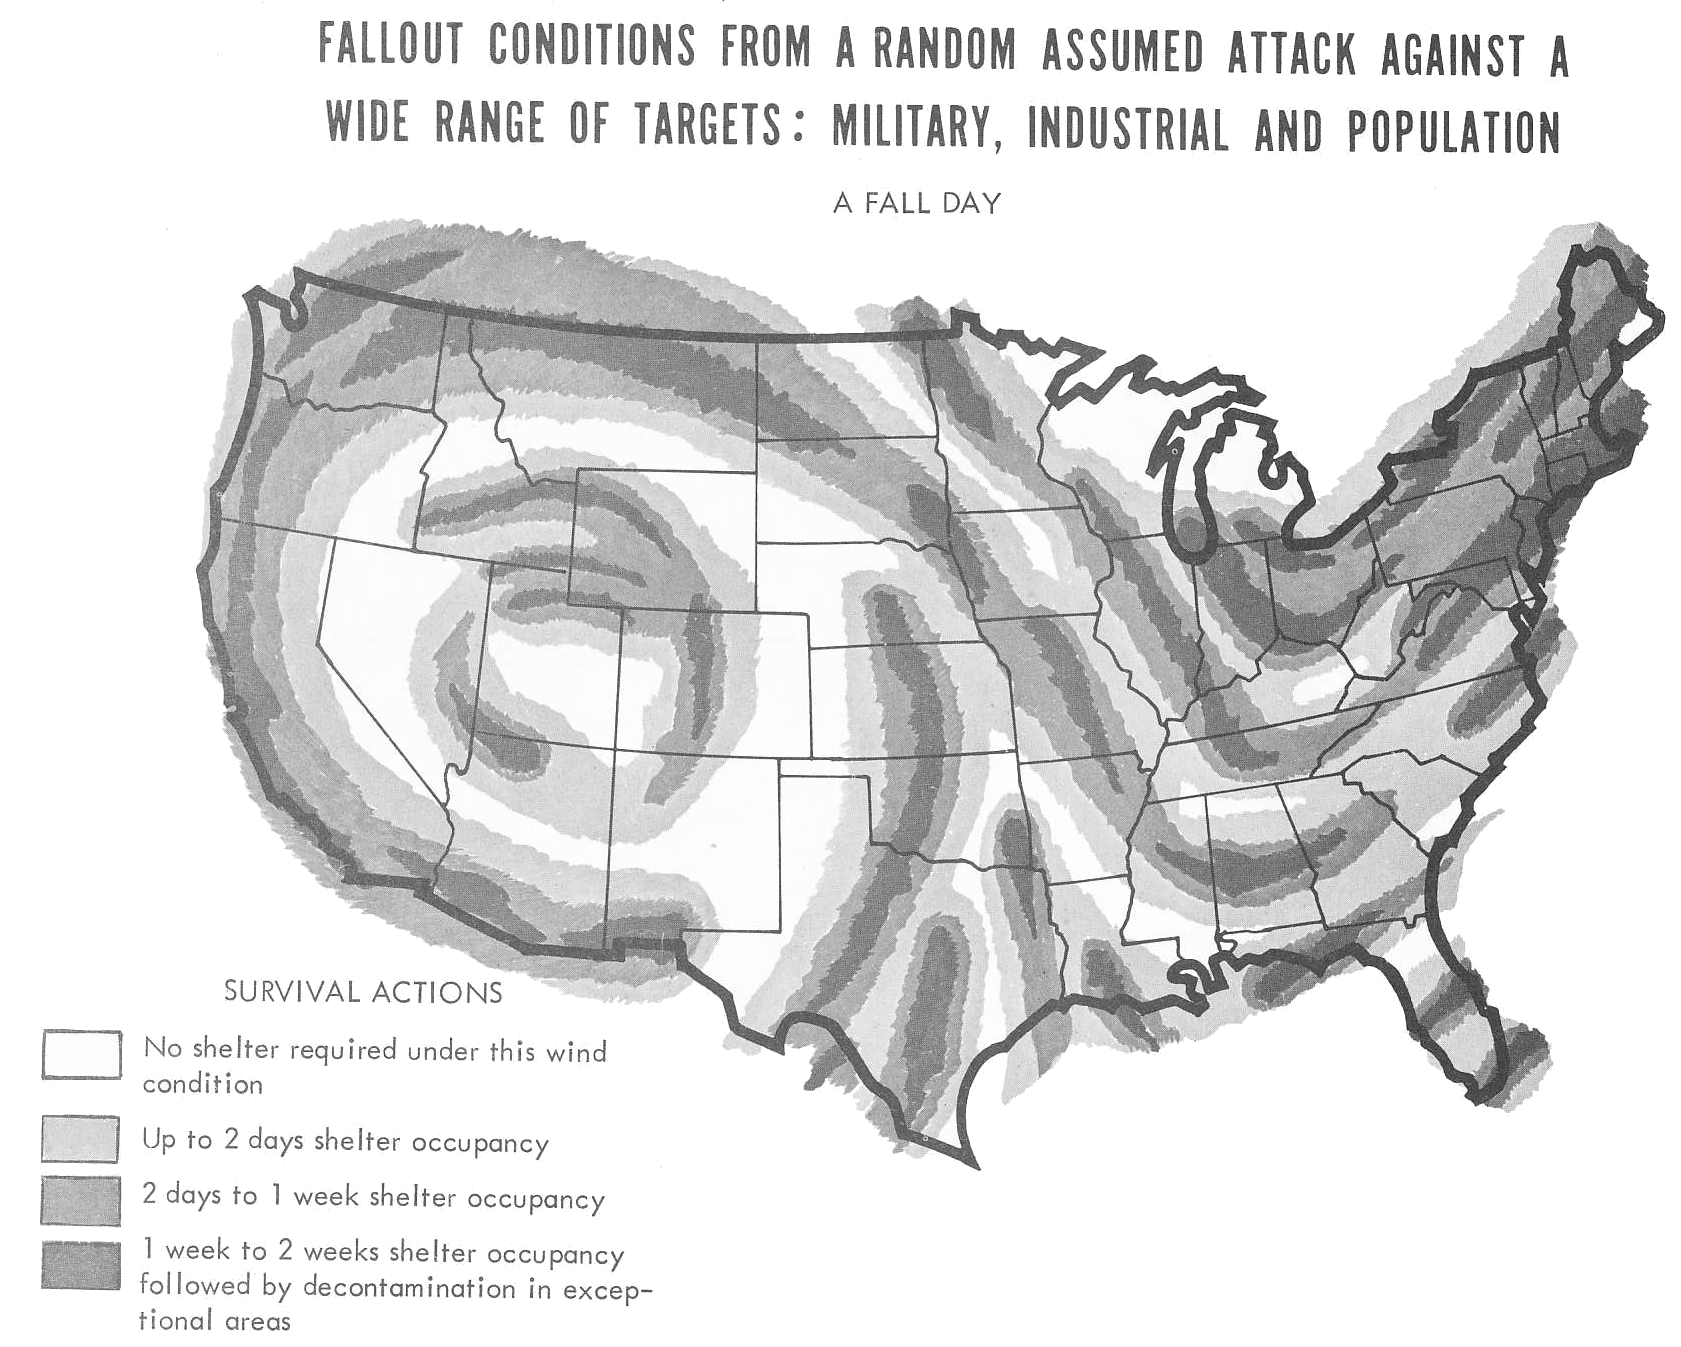
Applying a different set of winds would change these contours completely and, that’s what we’ve done in Figure 4.
Fig. 4 – FALLOUT CONDITIONS FROM A RANDOM ASSUMED ATTACK AGAINST A WIDE RANGE OF TARGETS: MILITARY, INDUSTRIAL, AND POPULATION – A FALL DAY
|
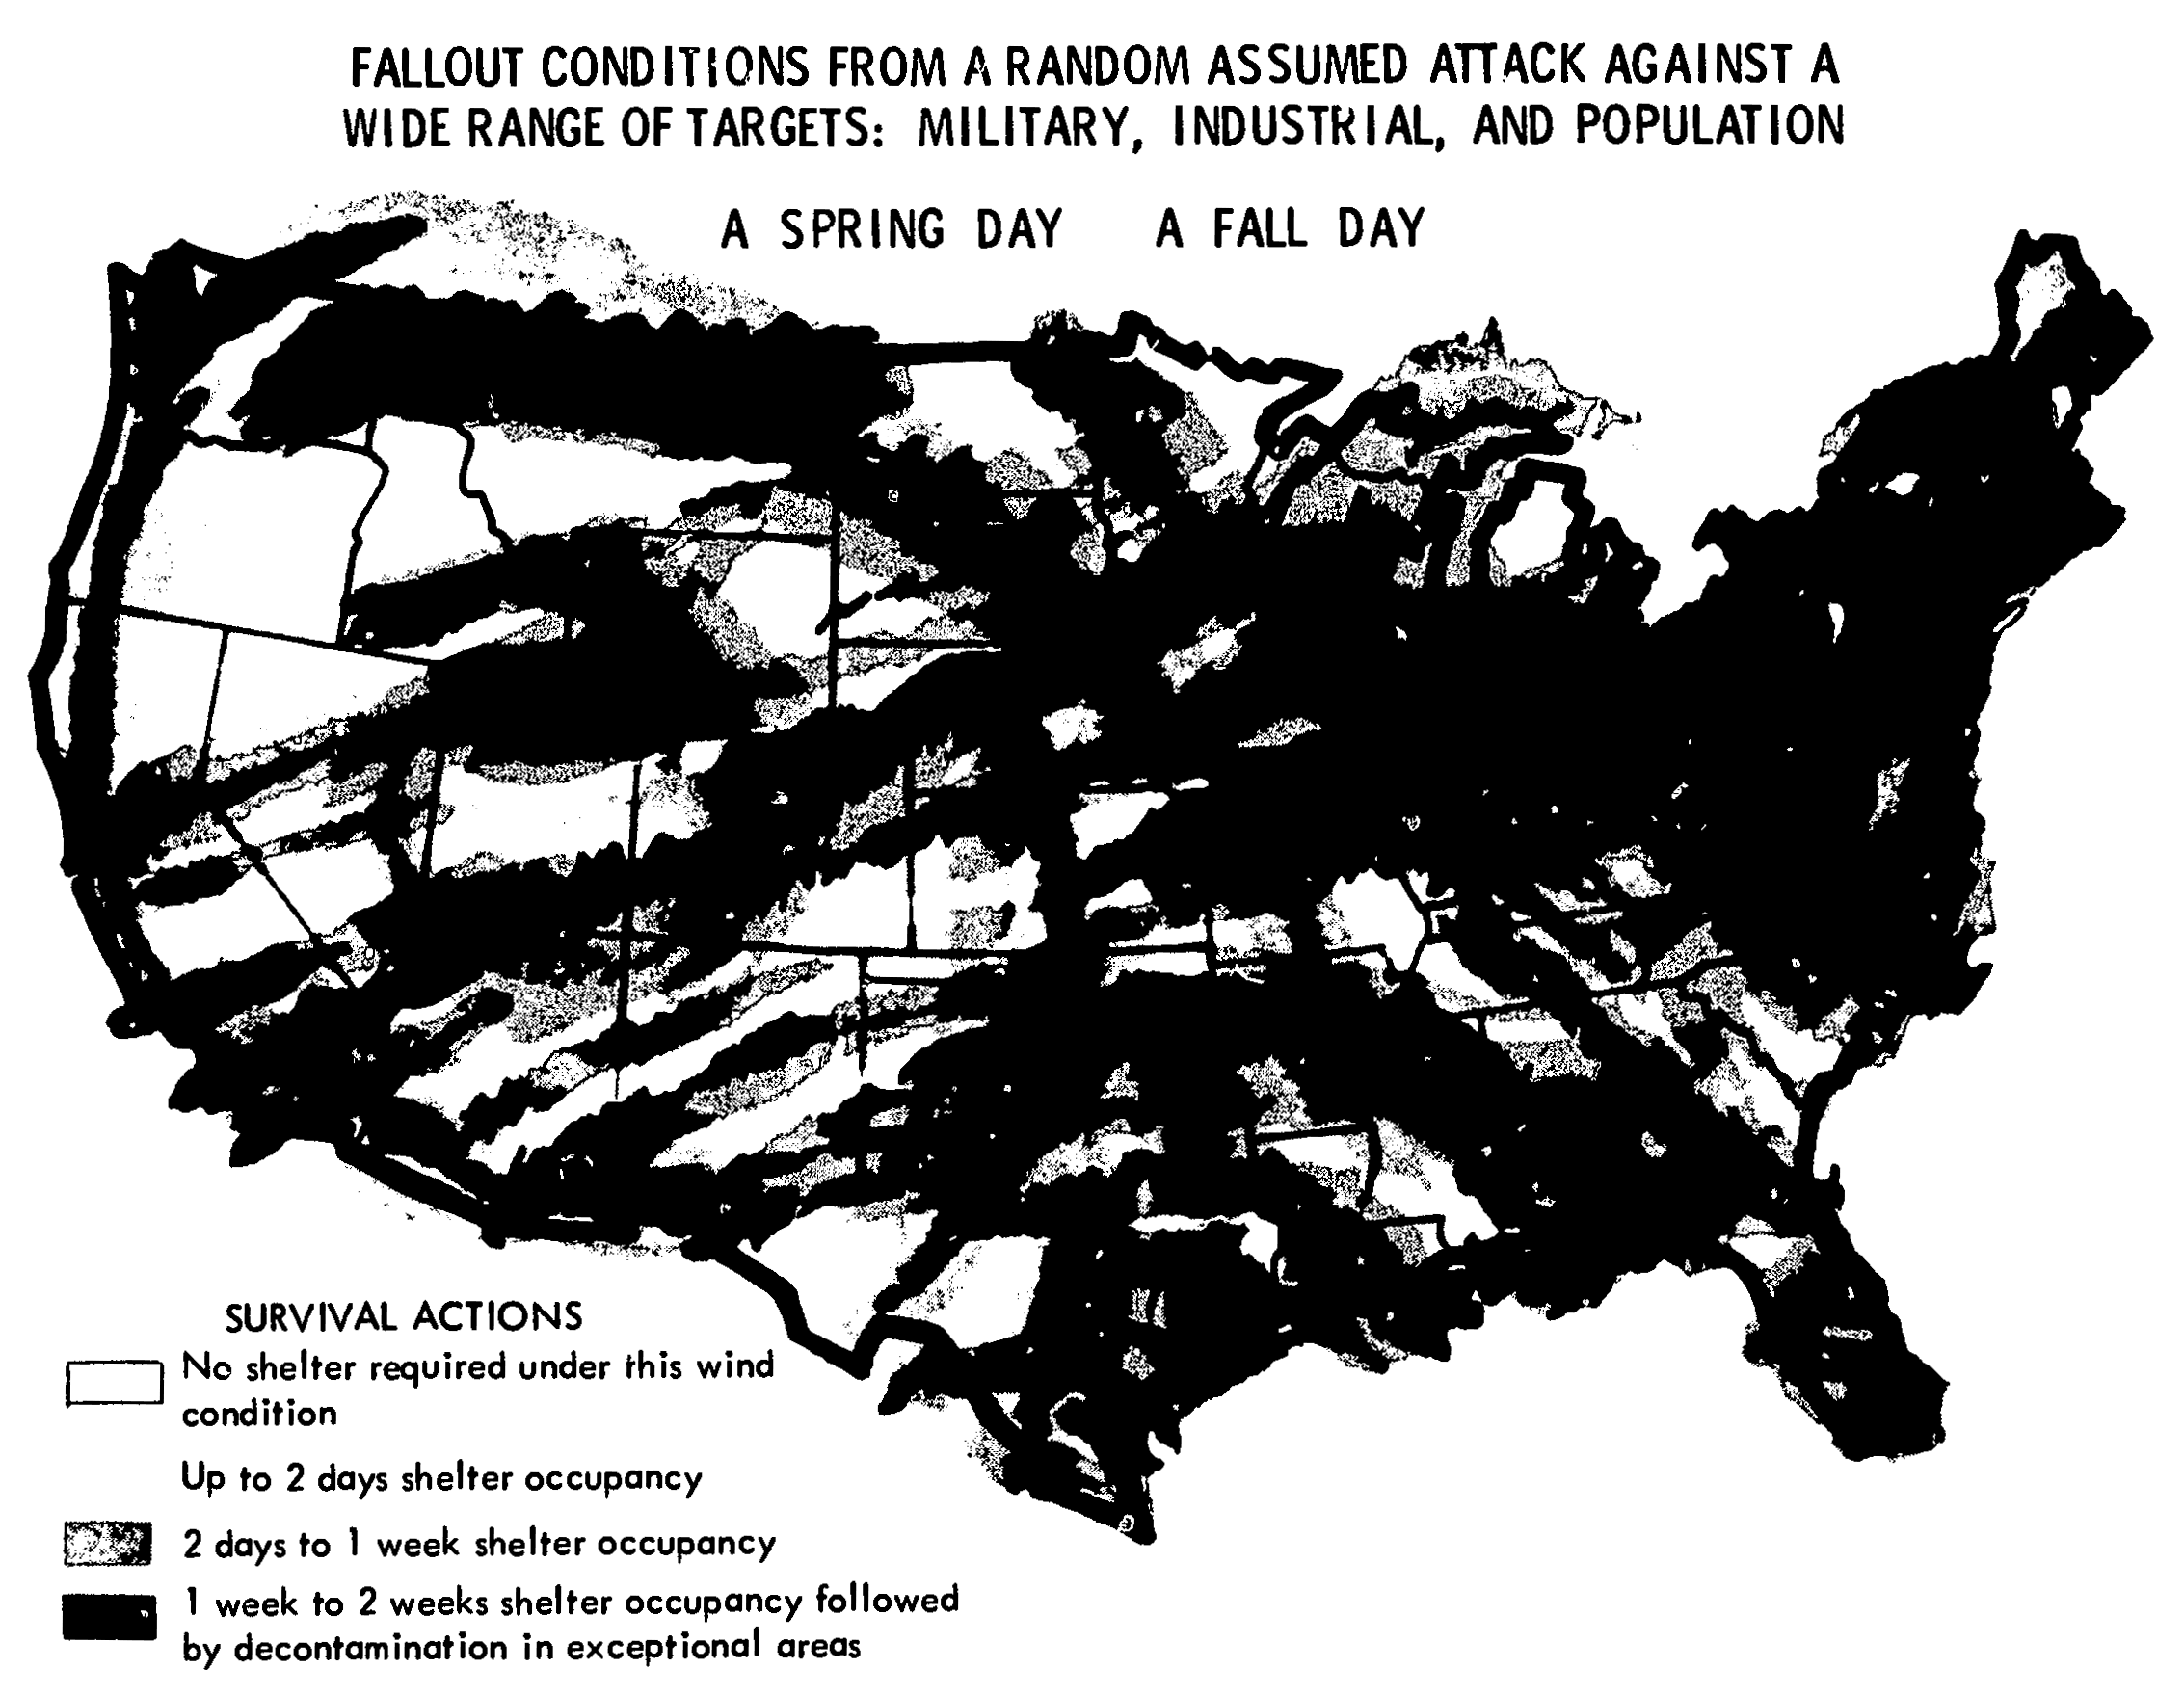
This is exactly the same set of ground detonations; 5500 megatons with two-thirds detonated on the ground. Only this time the winds are for a specific fall day. As you can see the amount of red-yellow-orange area is about the same, but it’s in different places. The point we make is; you can’t tell which winds are going to be blowing, where the weapons are going to be detonated and what the enemy objectives are likely to be. Therefore shelter would be needed everywhere in the country. By superimposing the two wind conditions, as in this Figure 5, we can see that practically every part of the country is covered.
Fig. 5 – FALLOUT CONDITIONS FROM A RANDOM ASSUMED ATTACK AGAINST A WIDE RANGE OF TARGETS: MILITARY, INDUSTRIAL, AND POPULATION – A SPRING DAY + A FALL DAY
|
Just with two sets of winds the case is made that there are very few places in the country that are exempt from radiation. Imagine what it would look like if there were 100 sets of winds superimposed, one on the other! We’ve done this, too, and the point is there isn’t anyplace in the country that can sit by and feel they have a good chance of being exempt from radiation. They have to know what’s going to be hit, the accuracy of the weapons, how good they are, how large they are, are they going to be air or ground bursts, what the winds would be, what the speed of the winds would be, what the atmospheric and weather conditions after detonation; it’s just impossible to guess at it. The conclusion is it’s a good idea to have a fallout shelter everywhere.
I may have made a real boogeyman.
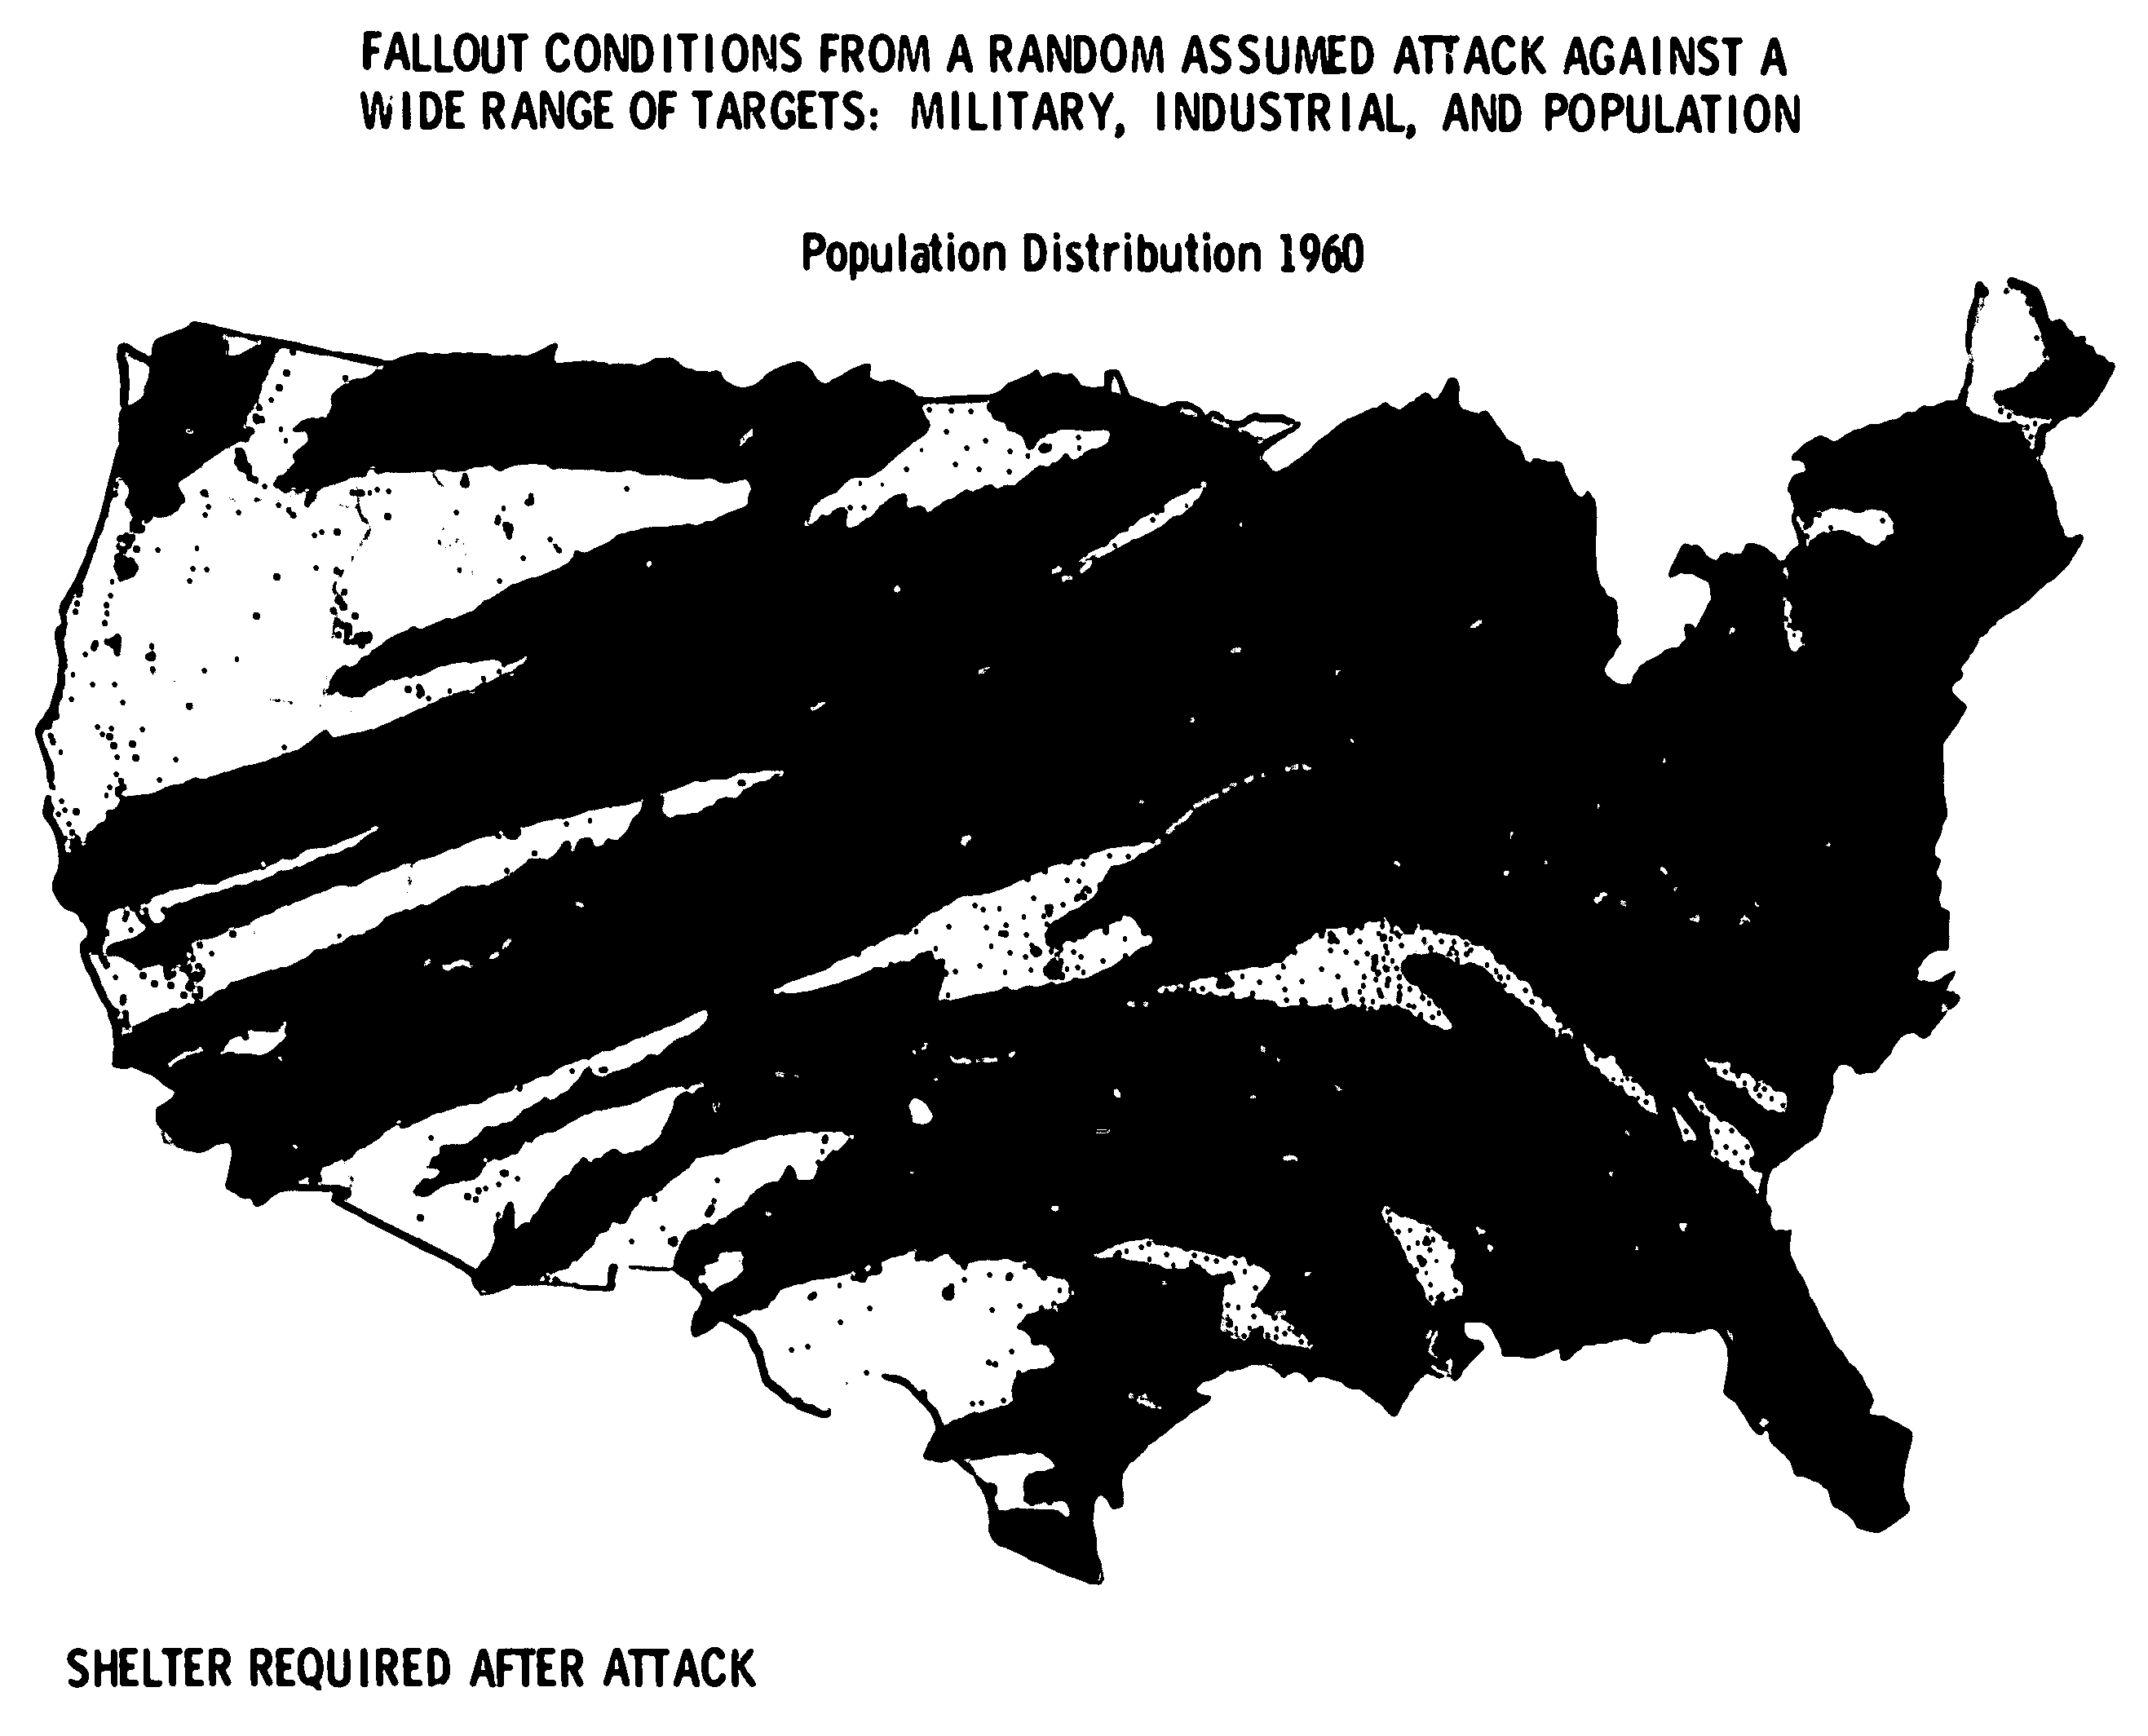
Let’s see Figure 6.
Fig. 6 – FALLOUT CONDITIONS FROM A RANDOM ASSUMED ATTACK AGAINST A WIDE RANGE OF TARGETS: MILITARY, INDUSTRIAL, AND POPULATION
|
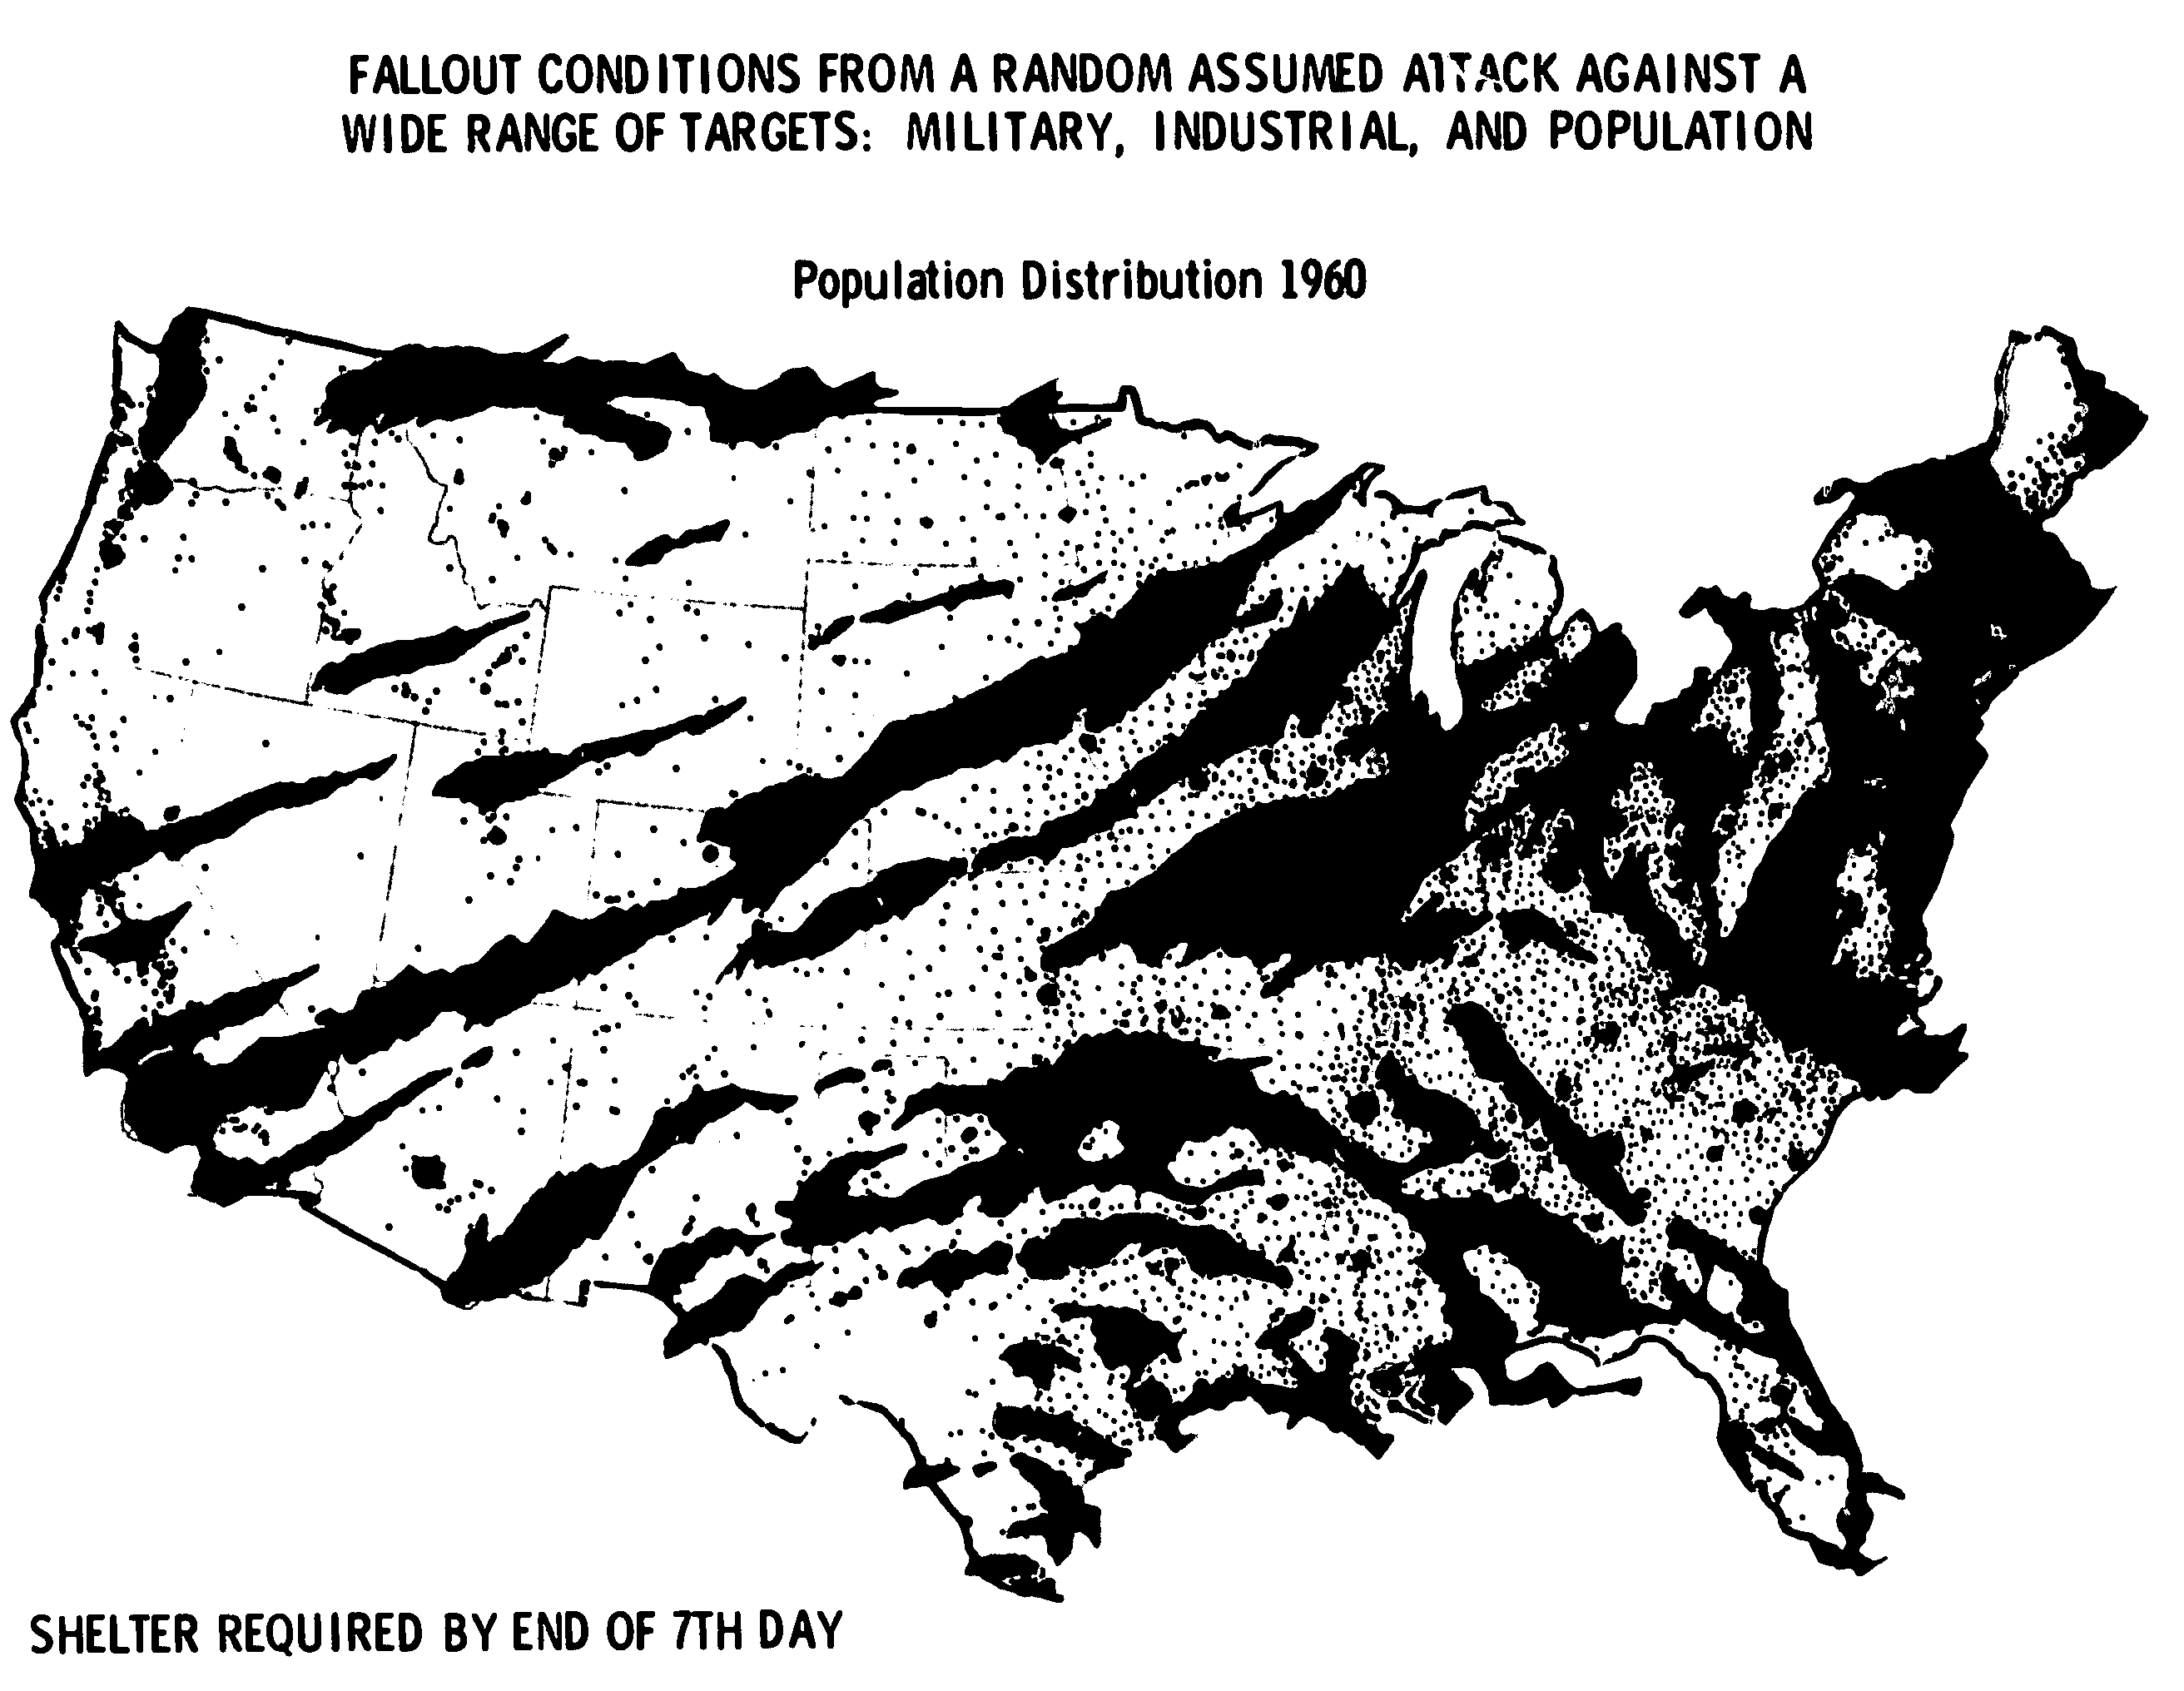
What you have here is a census map underneath with the size of the dots indicating the size of urbanized areas— population size. Each little tiny dot is equivalent to 10,000 population. This attack with spring winds, the one you’ve seen, is superimposed on that. The reason they don’t fit quite well is the fallout contours were developed on a Corps of Engineers’ map and the population dots a Census map.
As before, the shaded portions represent radioactive intensity levels. First of all, this is what it would look like soon after attack sometime between the 12th hour and the 18th hour after attack. The arriving fallout deposits on the ground.
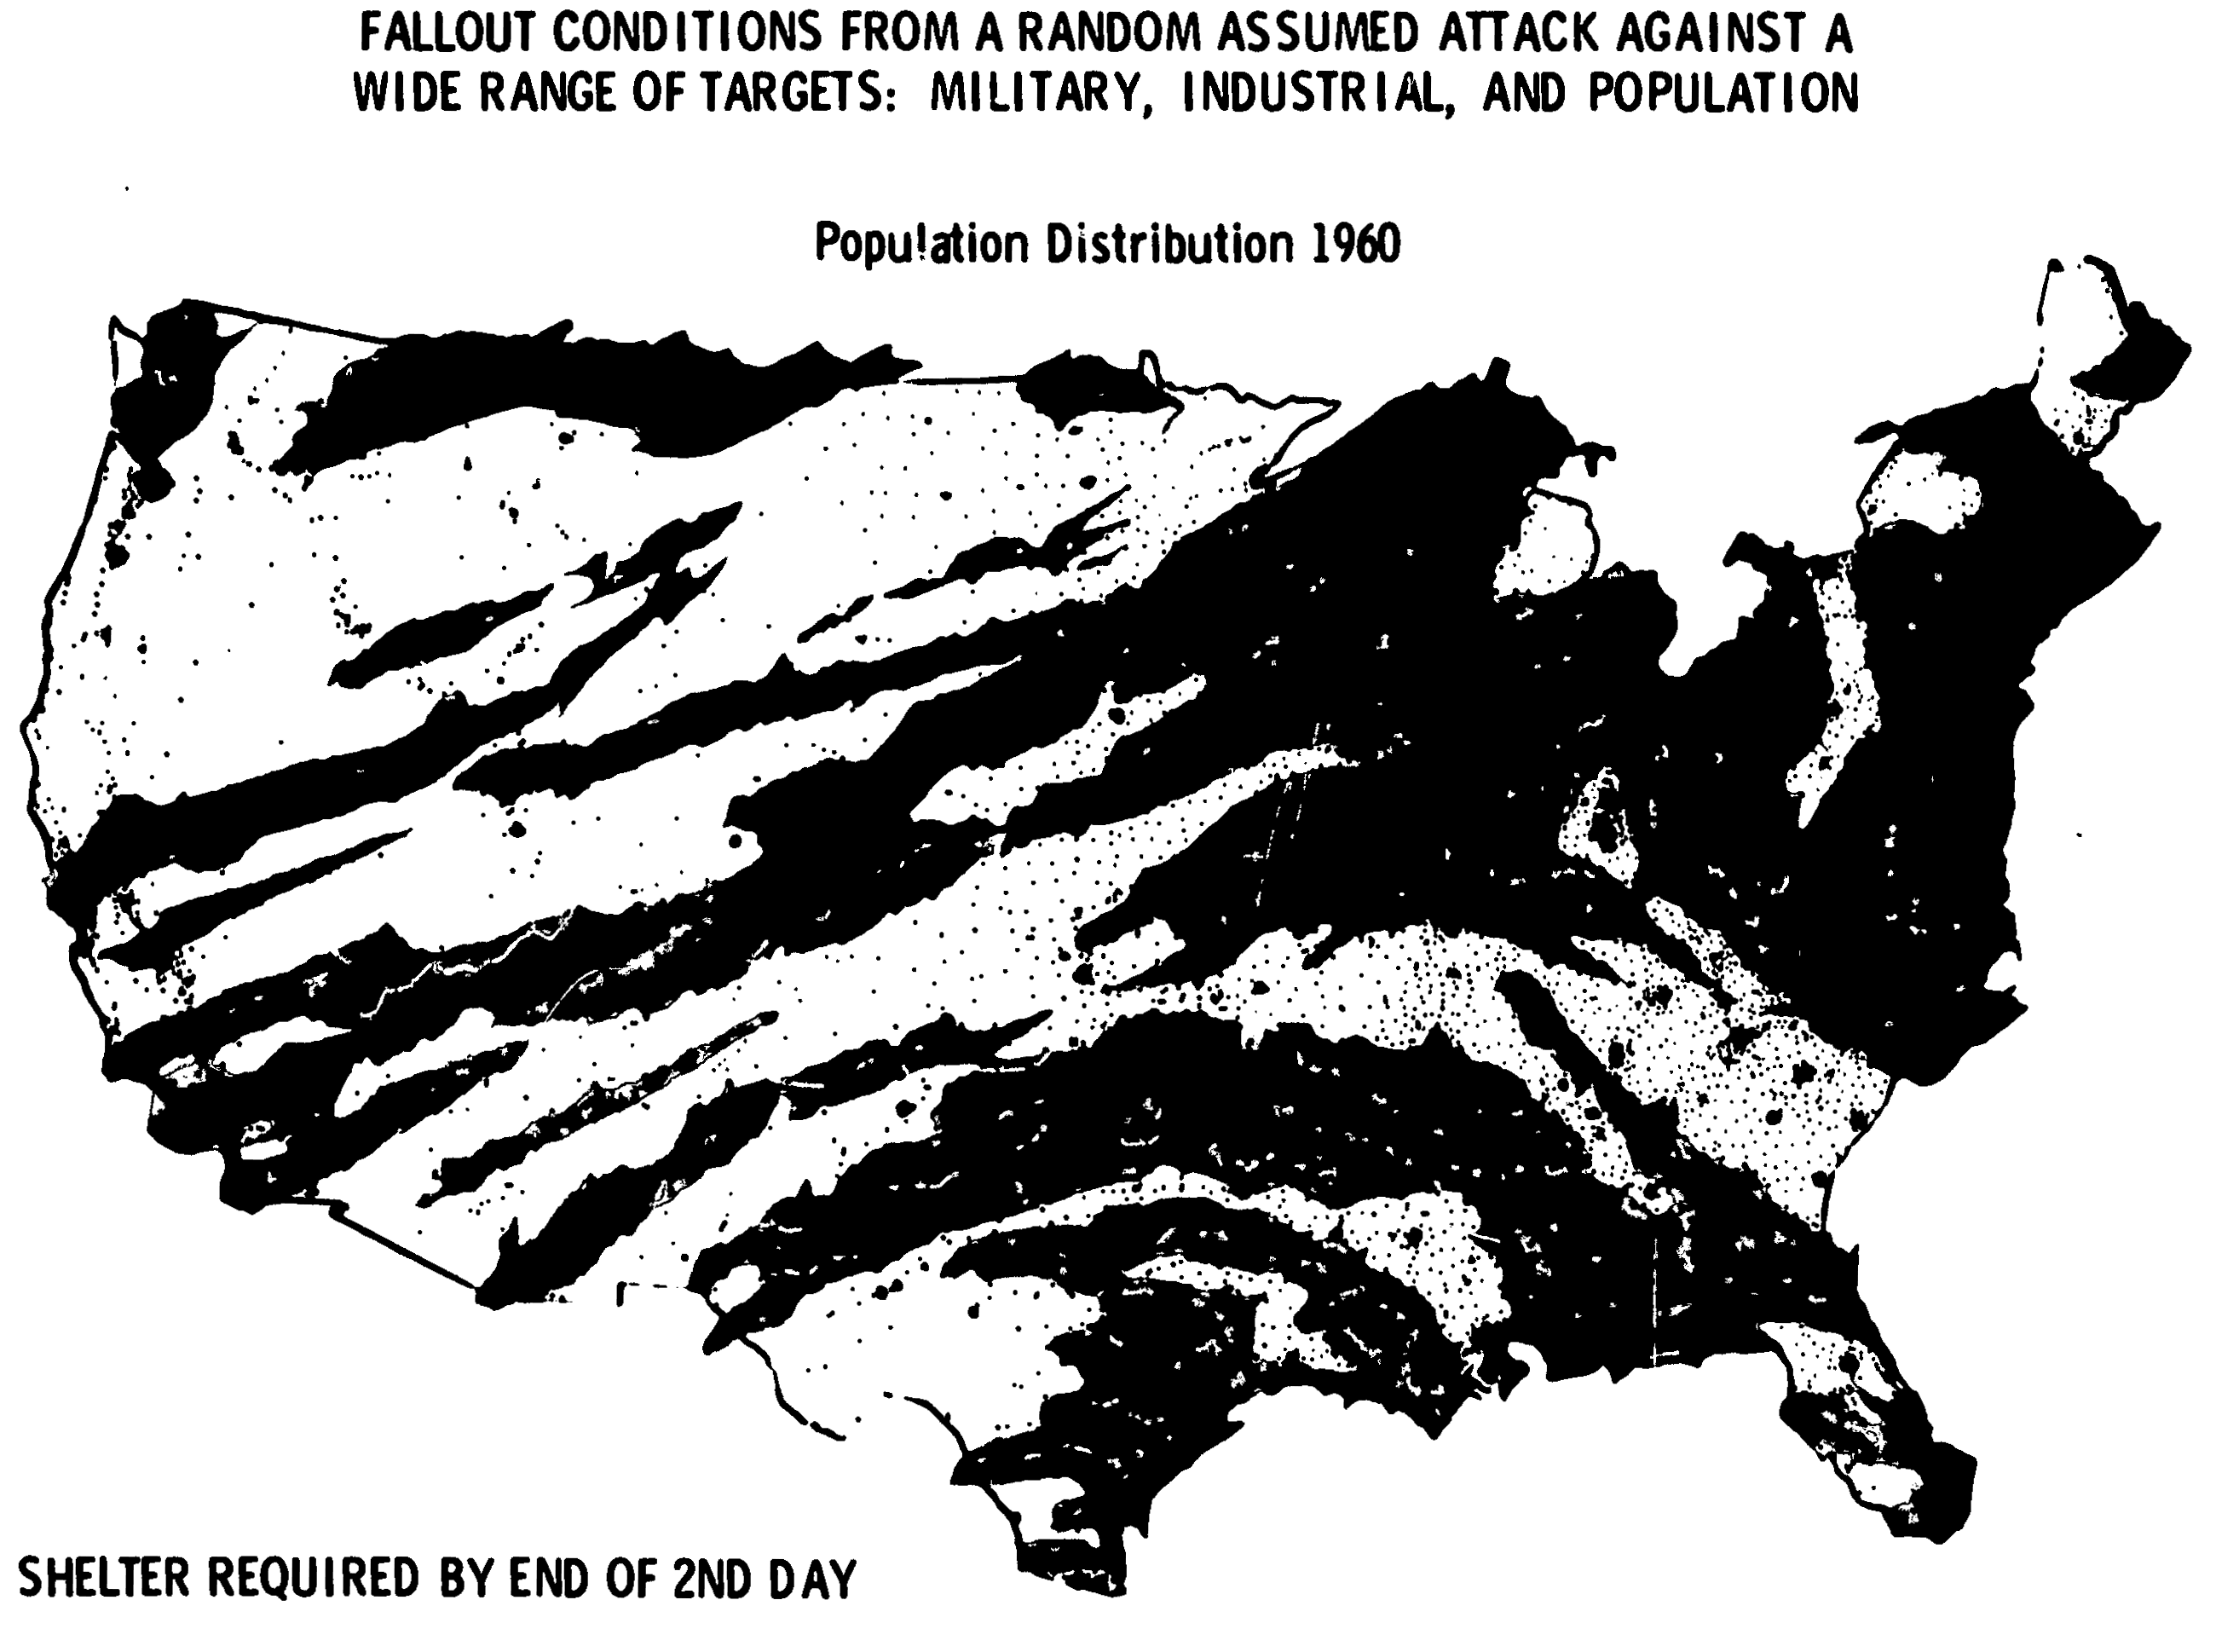
Let’s lift off the yellow area. See Figure 7.
FIG. 7 -- FALLOUT CONDITIONS FROM A RANDOM ASSUMED ATTACK AGAINST A WIDE RANGE OF TARGETS: MILITARY, INDUSTRIAL, AND POPULATION
|
Two days later the radiation of the lightest intensity would be decayed to the point where the people who were in the yellow area would be free of the threat of disabling fallout. Those who would have escaped the immediate effects of the blast would be able to go about their business; although certainly not normal business. They would be involved in recovery, rehabilitation, repair and coming to the aid of the rest of the country. In a week, the orange areas would disappear, see Figure 8, and that much more of the country would be freed.
FIG. 8 -- FALLOUT CONDITIONS FROM A RANDOM ASSUMED ATTACK AGAINST A WIDE RANGE OF TARGETS: MILITARY, INDUSTRIAL, AND POPULATION
|
Well over half of the population of the country would be available at the end of the week to move about. The remainder, as I’ve said, would be in for up to two weeks. In some exceptional areas decontamination might be required.
Radiation does not contaminate an area forever or pose a threat against which nothing can be done. The fact is that radioactive fallout decays rapidly. What we call the “rule of seven” indicates that the radiation intensity decays 90 percent for every time multiple of seven. This means at “h” plus 8 hours, it is one-tenth as intense as “h” plus 1 hour; at two weeks, one one-thousandth. So time’s on your side if you shelter yourself at the beginning; even though intensity is very high, the chances are very good that everyone who could survive will, if given fallout shelter.
Figure 9 indicates the threat to population and geography by a potential heavy attack.
Fig. 9 – EXPOSURE TO BLAST AND FALLOUT – HEAVY HYPOTHETICAL ATTACK ON CITIES, INDUSTRY AND MILITARY TARGETS |
||
|
POPULATION |
RADIATION LEVELS |
AREA |
|
60% |
Lethal Radiation |
37% |
|
25% |
Dangerous |
37% |
|
15% |
Exempt or Tolerable |
26% |
|
POPULATION |
BLAST LEVELS |
AREA |
|
21% |
Near Total Destruction |
0.5% |
|
18% |
Heavy Damage |
1.5% |
|
20% |
Moderate to Light Damage |
8% |
|
41% |
No Physical Damage |
90% |
|
* – Pounds per square inch of blast pressure |
||
The summary of the results of a series of hypothetical attacks similar to those we have been presenting are bar charted to show the amount of area of the country on the right-hand side and the number of people on the left-hand side that are affected by weapons effects.
I’ll deal with the bottom part first. In the area of total destruction, that area closest to the weapons that you saw in the first two charts, only half of one percent of the area of the country is affected by an attack even this large.
In the next area of heavy damage, only 1 and one half percent of this land area of the country is included, and 60 percent of the people there would survive with about 25 percent injured.
In addition to that, the third bar, which represents the periphery around these detonations, shows 8 percent of the land area with most of the people surviving.
At the very bottom: ninety percent of the area of the country and 41 percent of the population are unaffected by blast, even in an attack as mean and heavy as this one. Within the other parts only 30 percent of the population are killed, and remember population was a significant part of the targeting objective in this attack.
Now, let’s look at the radiation levels. First, the area—three-quarters of the country is covered with either lethal or disabling radiation. A quarter of the country is unaffected and people in these areas do not need protection at all. But from the previous figures you just can’t tell which quarter that would be in any attack. In this particular attack, fifteen percent of the population are in that area.
Sixty percent of the people are in areas of lethal radiation. Thirty percent of them are probably dead from initial effects. The other 30 percent who escaped the immediate effect of the attack, now are exposed to lethal radiation. An additional 25 percent are exposed to disabling radiation. That’s the proportion of the population we’re talking about when we talk about our objective—fallout protection for everyone. Thirty percent of the population with possible fatal doses, 25 percent of the population threatened with disabling doses— that’s the reason for our program. It is to save these people.
Figure 10 is an extract from another study.
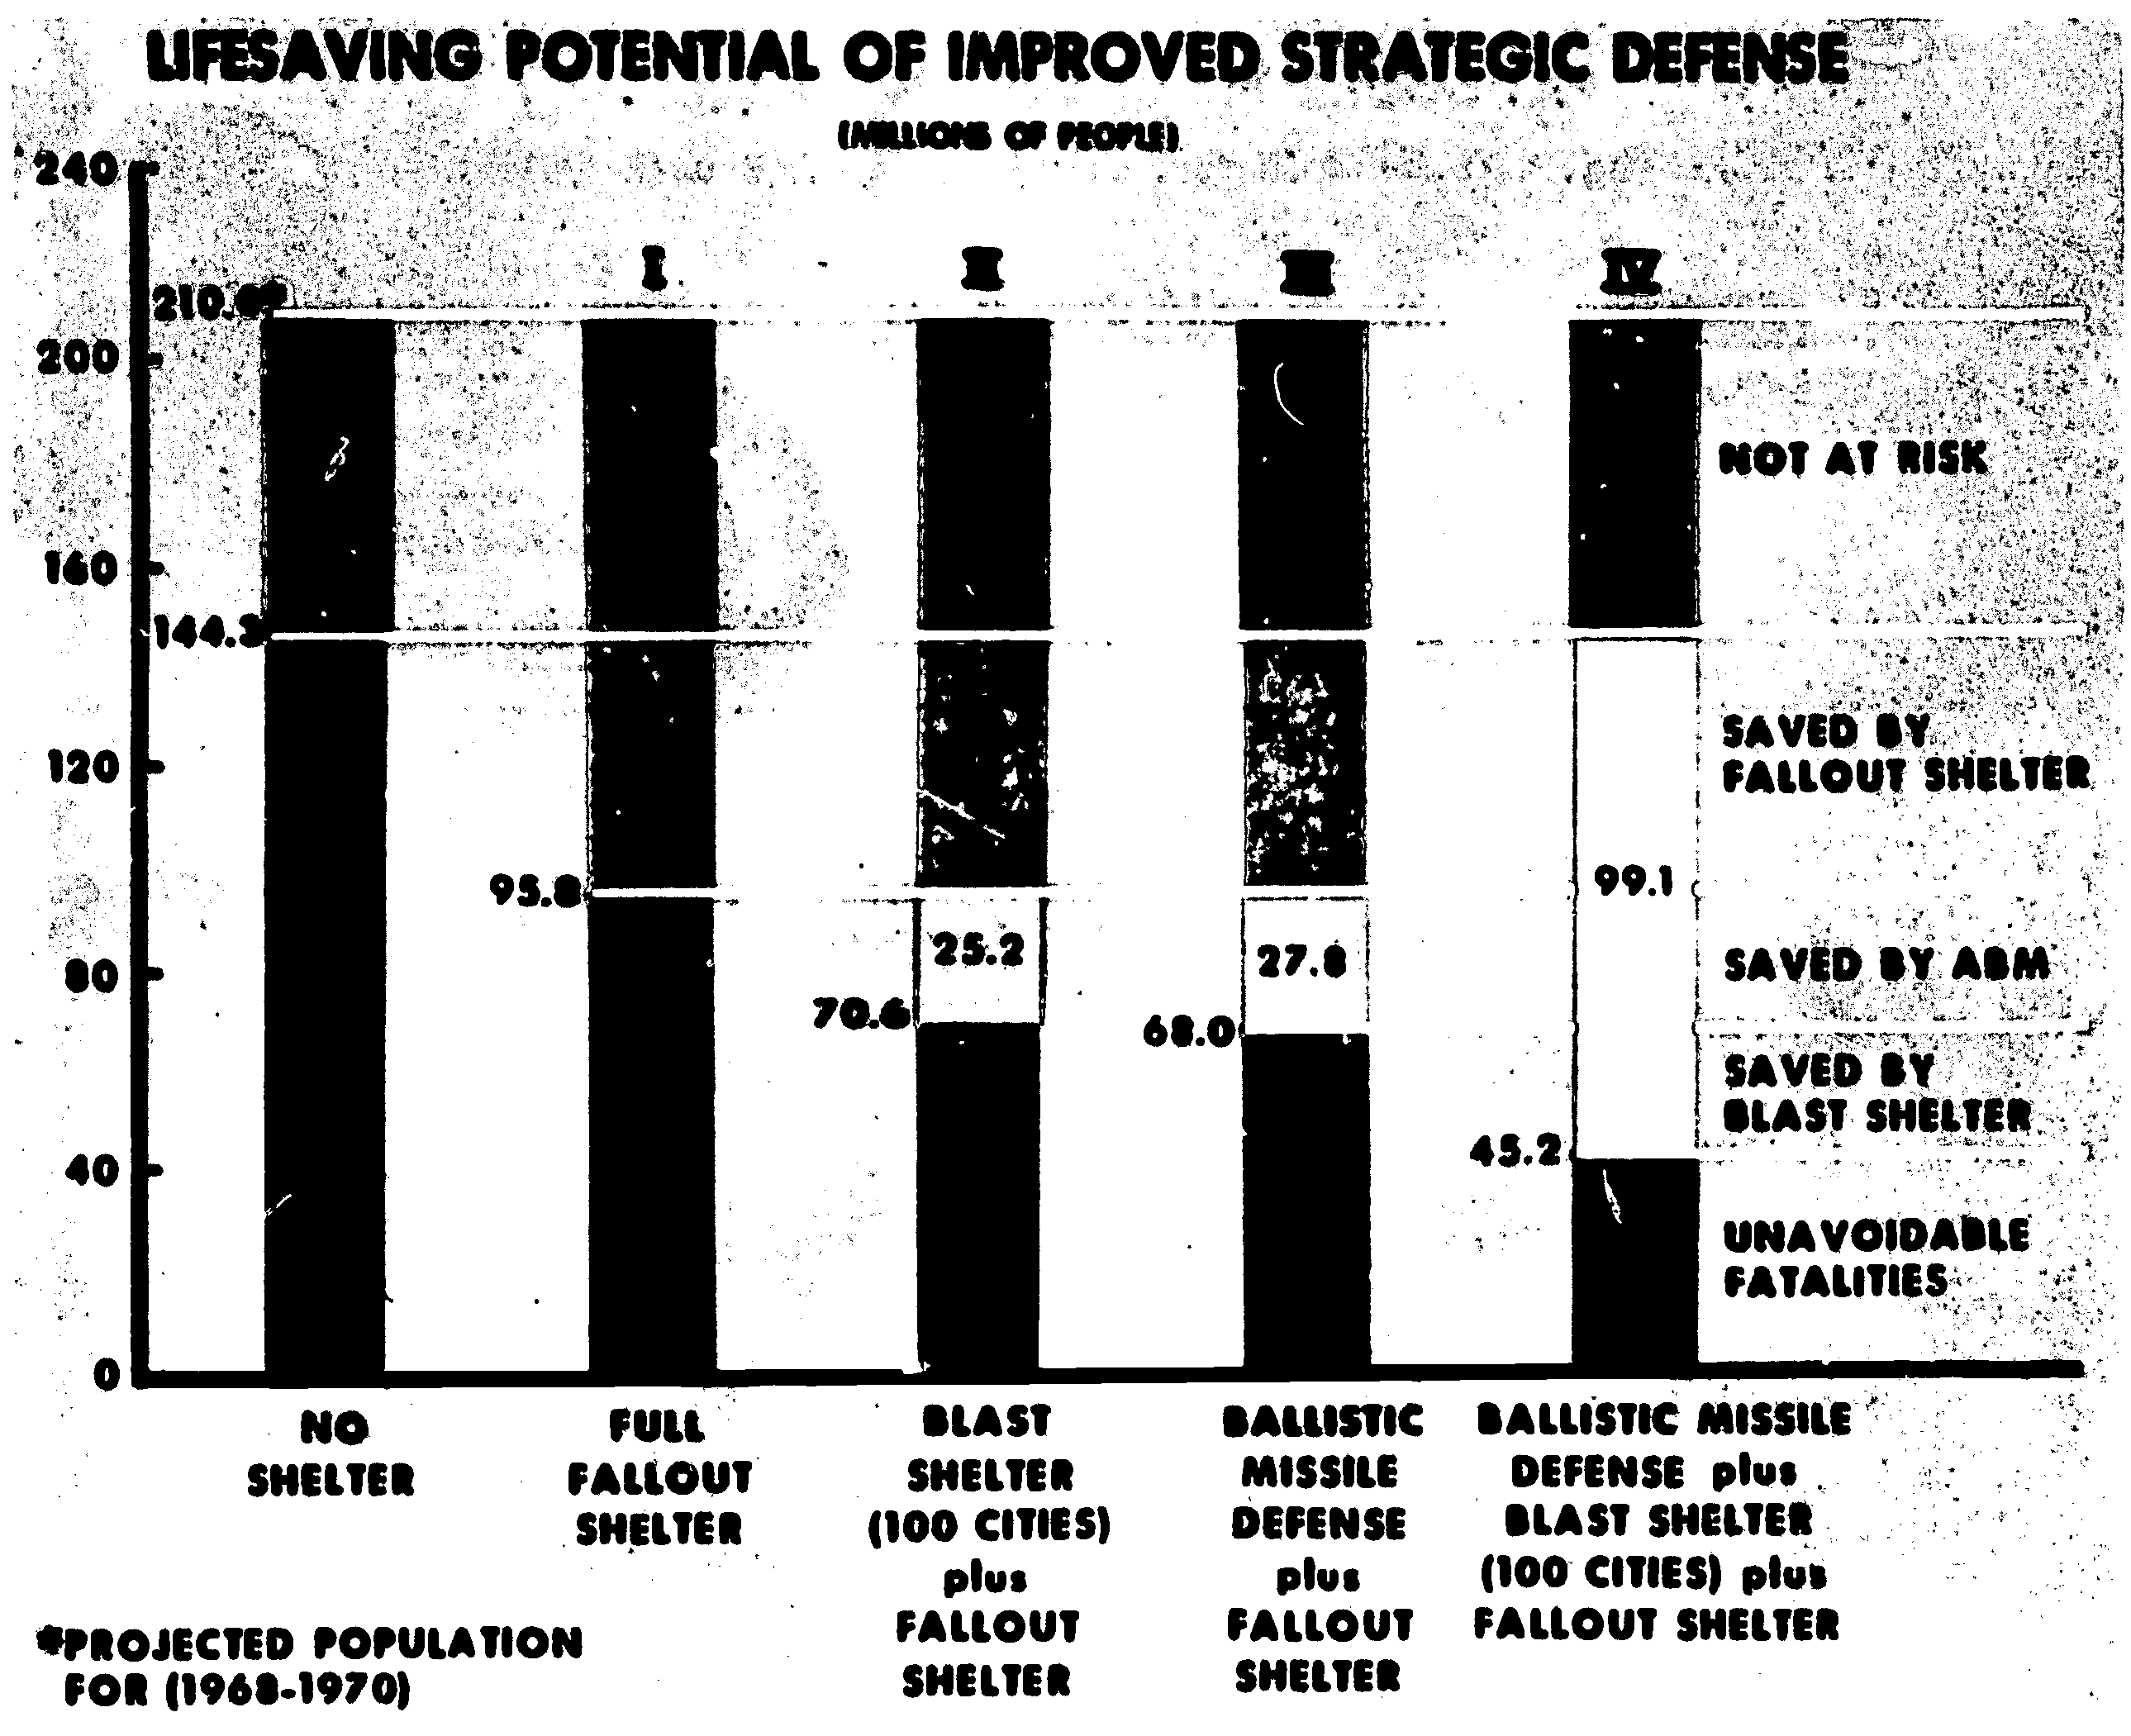
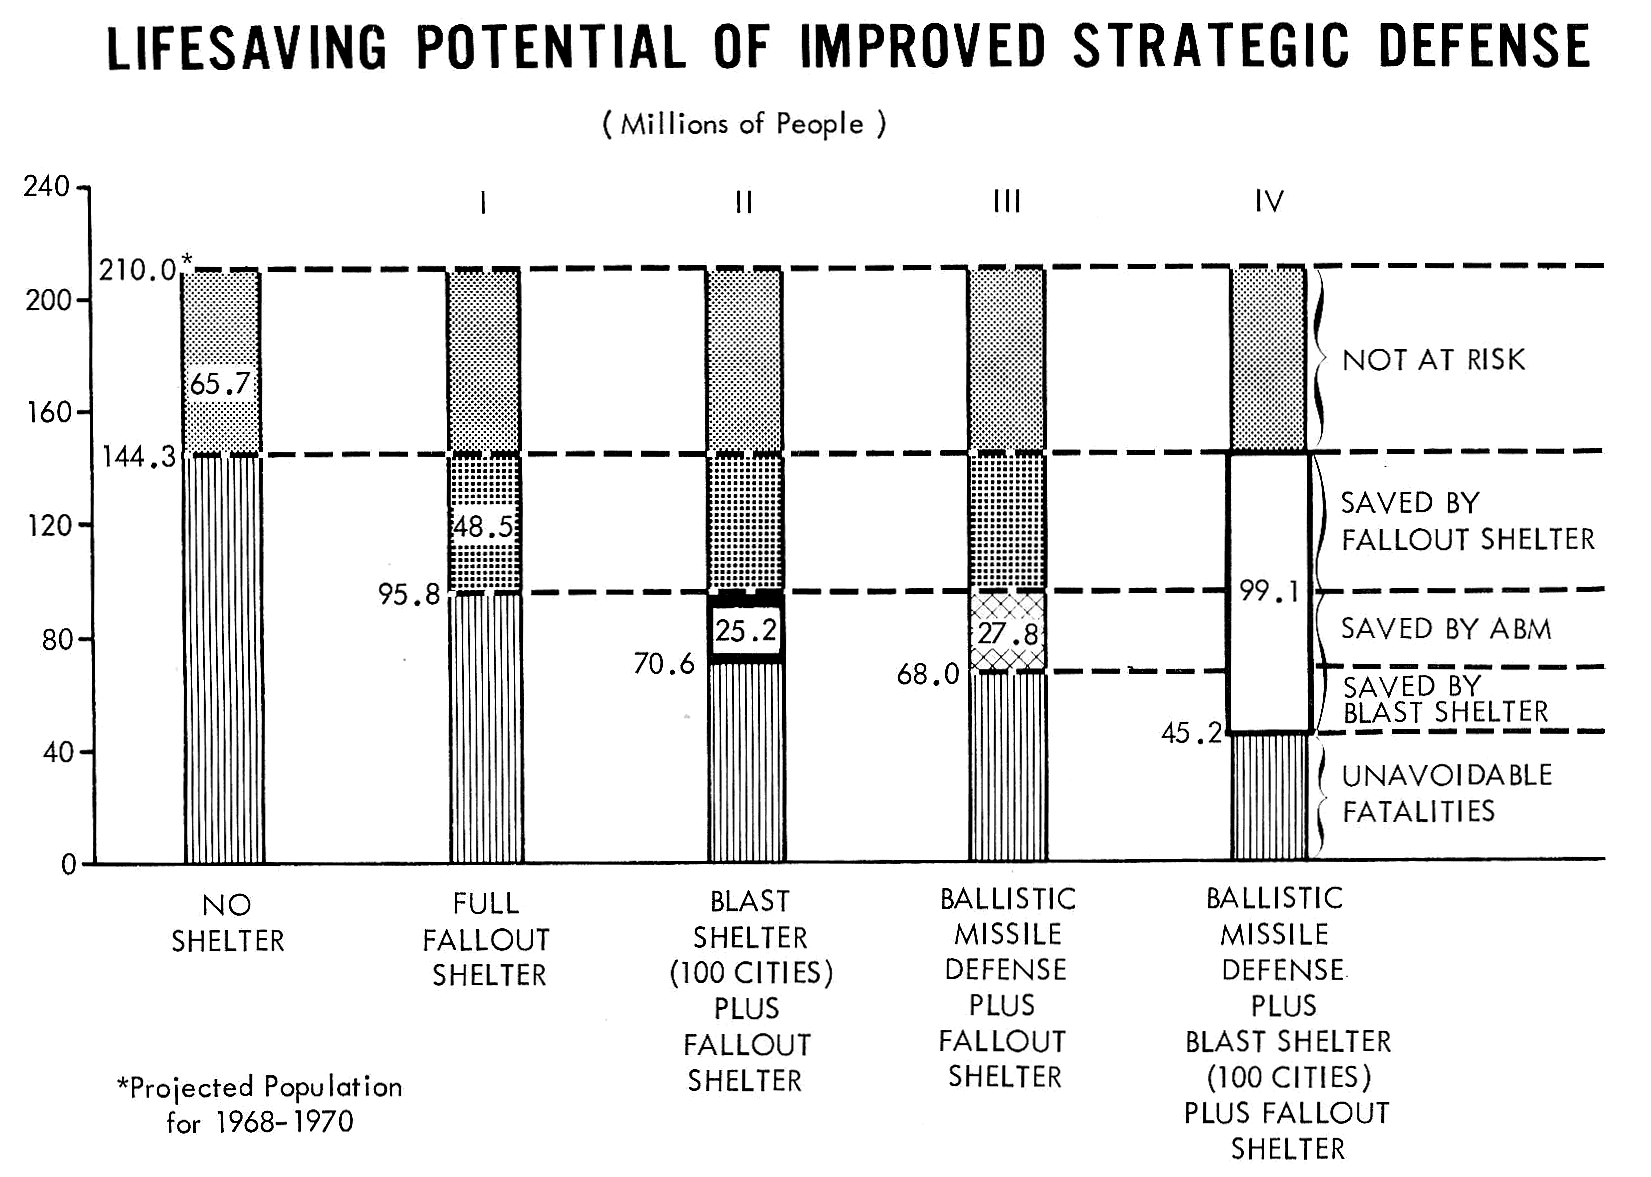
Fig 10 – LIFE SAVING POTENTIAL OF IMPROVED STRATEGIC DEFENSE
|
It compares different kinds of defense against the same kind of an attack. I want to describe this attack. It is again over 5000 megatons delivered—about 75 percent of it on the ground, causing fallout. Military targets were targeted, but the major portion of the attack was directed against population. It was directed against the population so that each additional weapon added picked up the next biggest increment of population. In other words, the return for each weapon was maximized; it killed the most people that were available to it. So, the figures here are extreme; but, the relative position of the defense systems is what we’re after.
First of all, 210 million population projected to 1970 is in between the census estimates of high fertility and low fertility rates for the country. First; the no shelter case, what we call our zero line—this is comparable to the Hiroshima experience. People were distributed in real estate at random, with some out in the open relatively unwarned and unprotected. In this type of maximized-kill attack 144 million people would die. You who have seen Secretary McNamara’s posture statements will recognize these figures. This is essentially what he presented to the Congress in February of last year.
In the next bar a full fallout shelter program is applied to this attack. About 50 million people are saved by full fallout protection. I’d like to make the point that when I say full protection, it’s a very pessimistic kind of protection. First of all, in all of our studies, we assume that ten percent of our population did not avail themselves of the protection. They are either stubborn, don’t get word, stupid, don’t believe what they hear, or just rugged individuals. Then we degrade that protection of the 90 percent of the people, because we assume they wouldn’t use it properly. They arrive late, come out too soon, don’t go back often enough on their foraging trips, or remain out. In other words, we just take a pessimistic view of human behavior and we degrade the protection factors accordingly. With this type of a pessimistic attack and with our pessimistic assumptions as to how people would use fallout protection, still, almost 50 million people would be saved by this kind of a program.
Current estimates of the cost of full fallout shelter protection developed and deployed over ten years—the full program of course, not just the shelter—including the 600 million dollars we have spent since 1962 is 3.5 billion dollars. It’s not a small sum. But over 10 years it’s a very small increment of the Defense budget.
Bar Number II takes the same fallout protection program but adds blast protection in the 100 largest cities. This is a feasible, real good blast protection of thirty pounds per square inch protection in central cities and 10 pounds per square inch protection in the suburbs of 100 largest cities having about half the total population. Also, these were targeted cities. So it had a tough job on its hands, and it saved an additional 25 million people. But, it costs about 25 billion dollars. An order of magnitude higher cost than a fallout shelter program.
Bar Number III takes the fallout shelter program and adds a ballistic missile defense from last year’s study. We assumed a really super-duper Nike X system. It reacted perfectly, not only limiting damage, but denying damage to the places that it protected. That system was deployed in the 22 largest cities in the country. It saved 28 million people. It would cost somewhere between 14 and 18 billion dollars to deploy such a system. Obviously, dollar for dollar and it’s better than a blast shelter program; if it worked as good as assumed. It saves property as well. But that too is an order to magnitude higher cost than a full fallout shelter program. If you took all three programs together in Bar IV, at a cost of over 40 billion dollars, you could save 100 million people in this kind of an attack. Still, we have 45 million people labeled as unavoidable fatalities who would still be killed in this kind of an attack.
The points I want to make with this chart are: first, it’s from this kind of data that Secretary McNamara concluded and stated publicly that fallout protection has the highest priority in his defense program. I’m distinguishing between defense and offense. In a strategic defense program, fallout protection—fallout shelter, has his highest priority and he gets the best return for the dollar. He has continued accelerated research and development efforts in the ballistic missile defense area and we in the Civil Defense organization are continuing our efforts in blast shelter research seeking lower cost solutions. That’s the first conclusion.
The second conclusion is: in Civil Defense we do not now and we never have made the case that civil defense is the solution for total defense. We can’t accomplish the job ourselves; it’s got to take additional increments of defense. But what we do; we do very well. And, that is to protect the population against fallout. It can be done, and as Jim Roembke, Director, Architectural and Engineering Services Division, has told you, it can be done at reasonable cost.
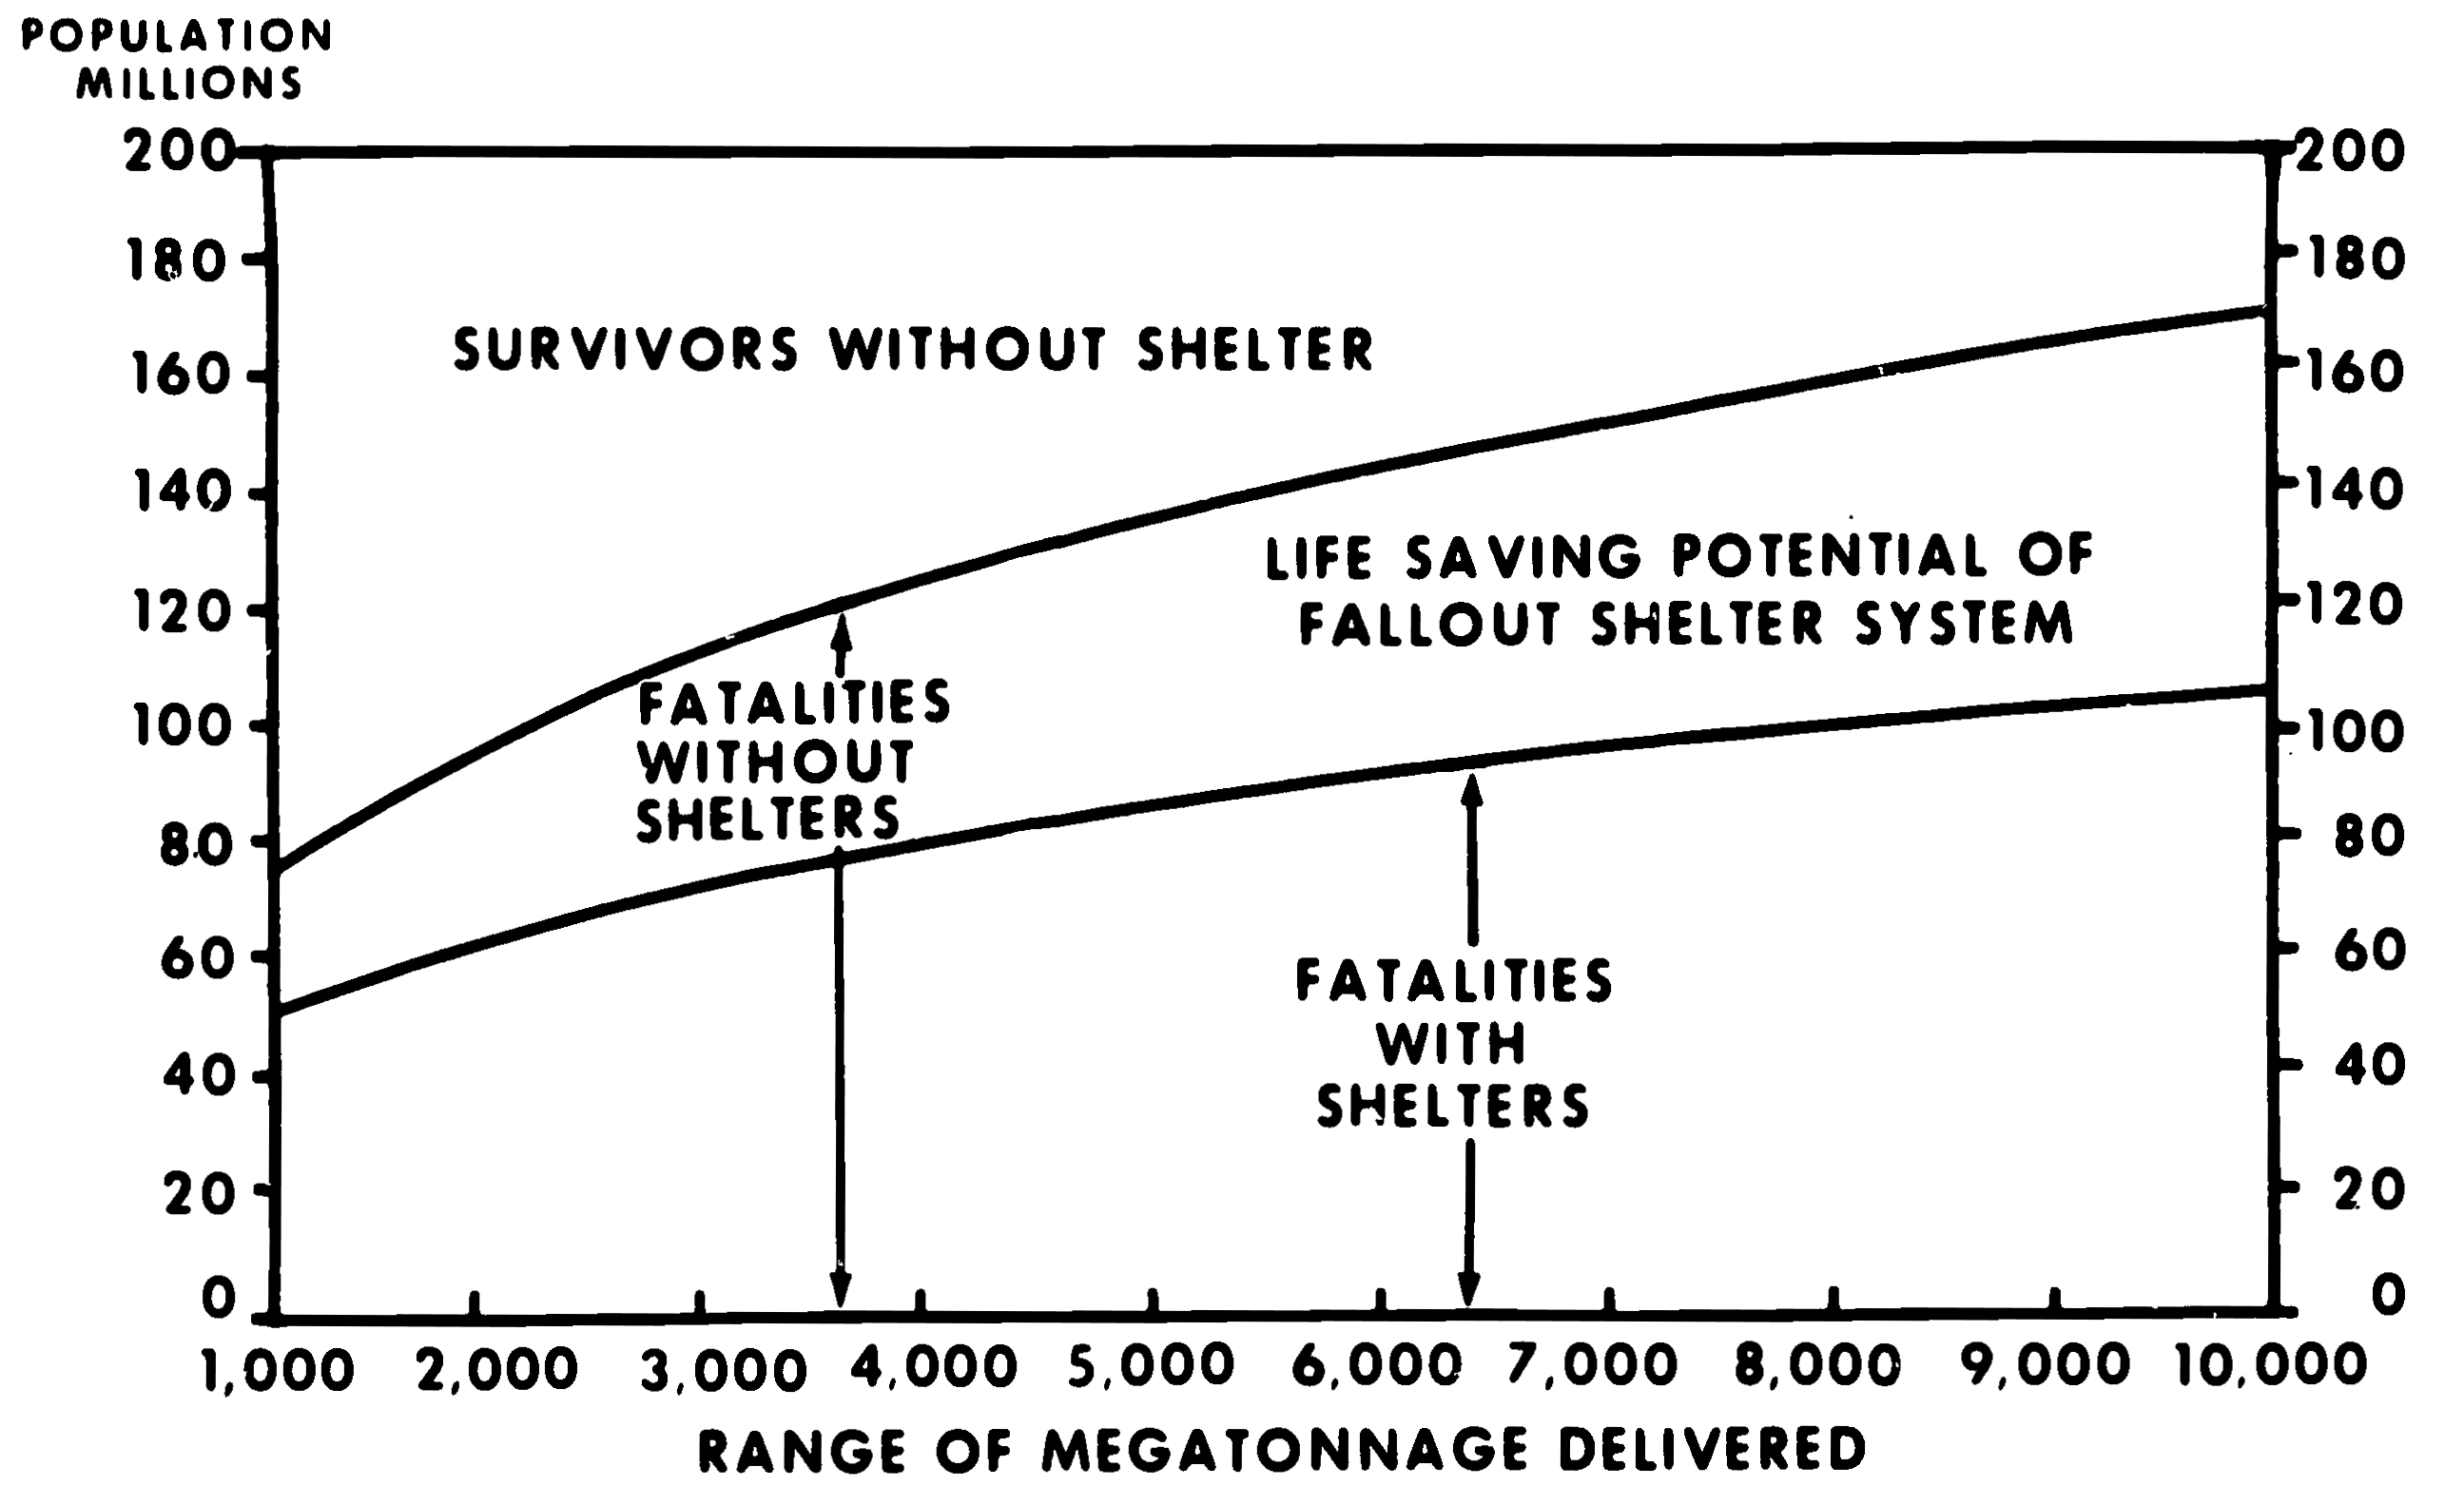
Figure 11 is a compendium of, at the time it was drawn, 22 different studies consisting of myriad attacks as well as assumptions included in our current estimates of the situation. It depicts estimates of population saved or lost. The bottom scale indicates the range of megatonnage from 1,000 to 10,000 delivered against a mixed target system. The top band shows those who would survive without shelter; i.e., the people who were in the white areas in the previous fallout maps. As the weight of the attack increases this band becomes smaller. In the bottom band are the people in the impact areas who would be fatally injured. The middle portion is the people who would be lost, but who could be saved if provided with fallout shelters. These studies indicate that under heavy attack about half of all survivors would result from fallout shelter protection.
Fig 11 – LIFE SAVING POTENTIAL OF FALLOUT SHELTER SYSTEM IN ATTACKS AGAINST MILITARY-URBAN-INDUSTRIAL TARGETS
SOURCE: COMPOSITE OF DAMAGE ASSESSMENT STUDIES BY DEPARTMENT OF DEFENSE IN EVENT OF ATTACKS AGAINST MILITARY TARGETS ALONE. TOTAL FATALITIES WOULD BE REDUCED AND LIFE SAVING POTENTIAL OF SHELTERS WOULD BE INCREASED |
And, more importantly, fallout protection alone will save larger and larger numbers of the population as enemy capabilities increase; a larger and larger proportion of those who survive would survive as a result of the fallout protection. The only point I want to draw from this figure is that the program itself will not be obsoleted by increased enemy capabilities. It just won’t happen as long as the weapons are nuclear and it looks like they will be for a long time.
That’s usually the end of this step-by-step build up in the logic of the basis of the program. I have prepared a couple of additional figures to deal with the problem of: “Why PF 40?” I apologize because it’s on semi-logarithmic paper; otherwise I couldn’t have gotten it all one one chart.
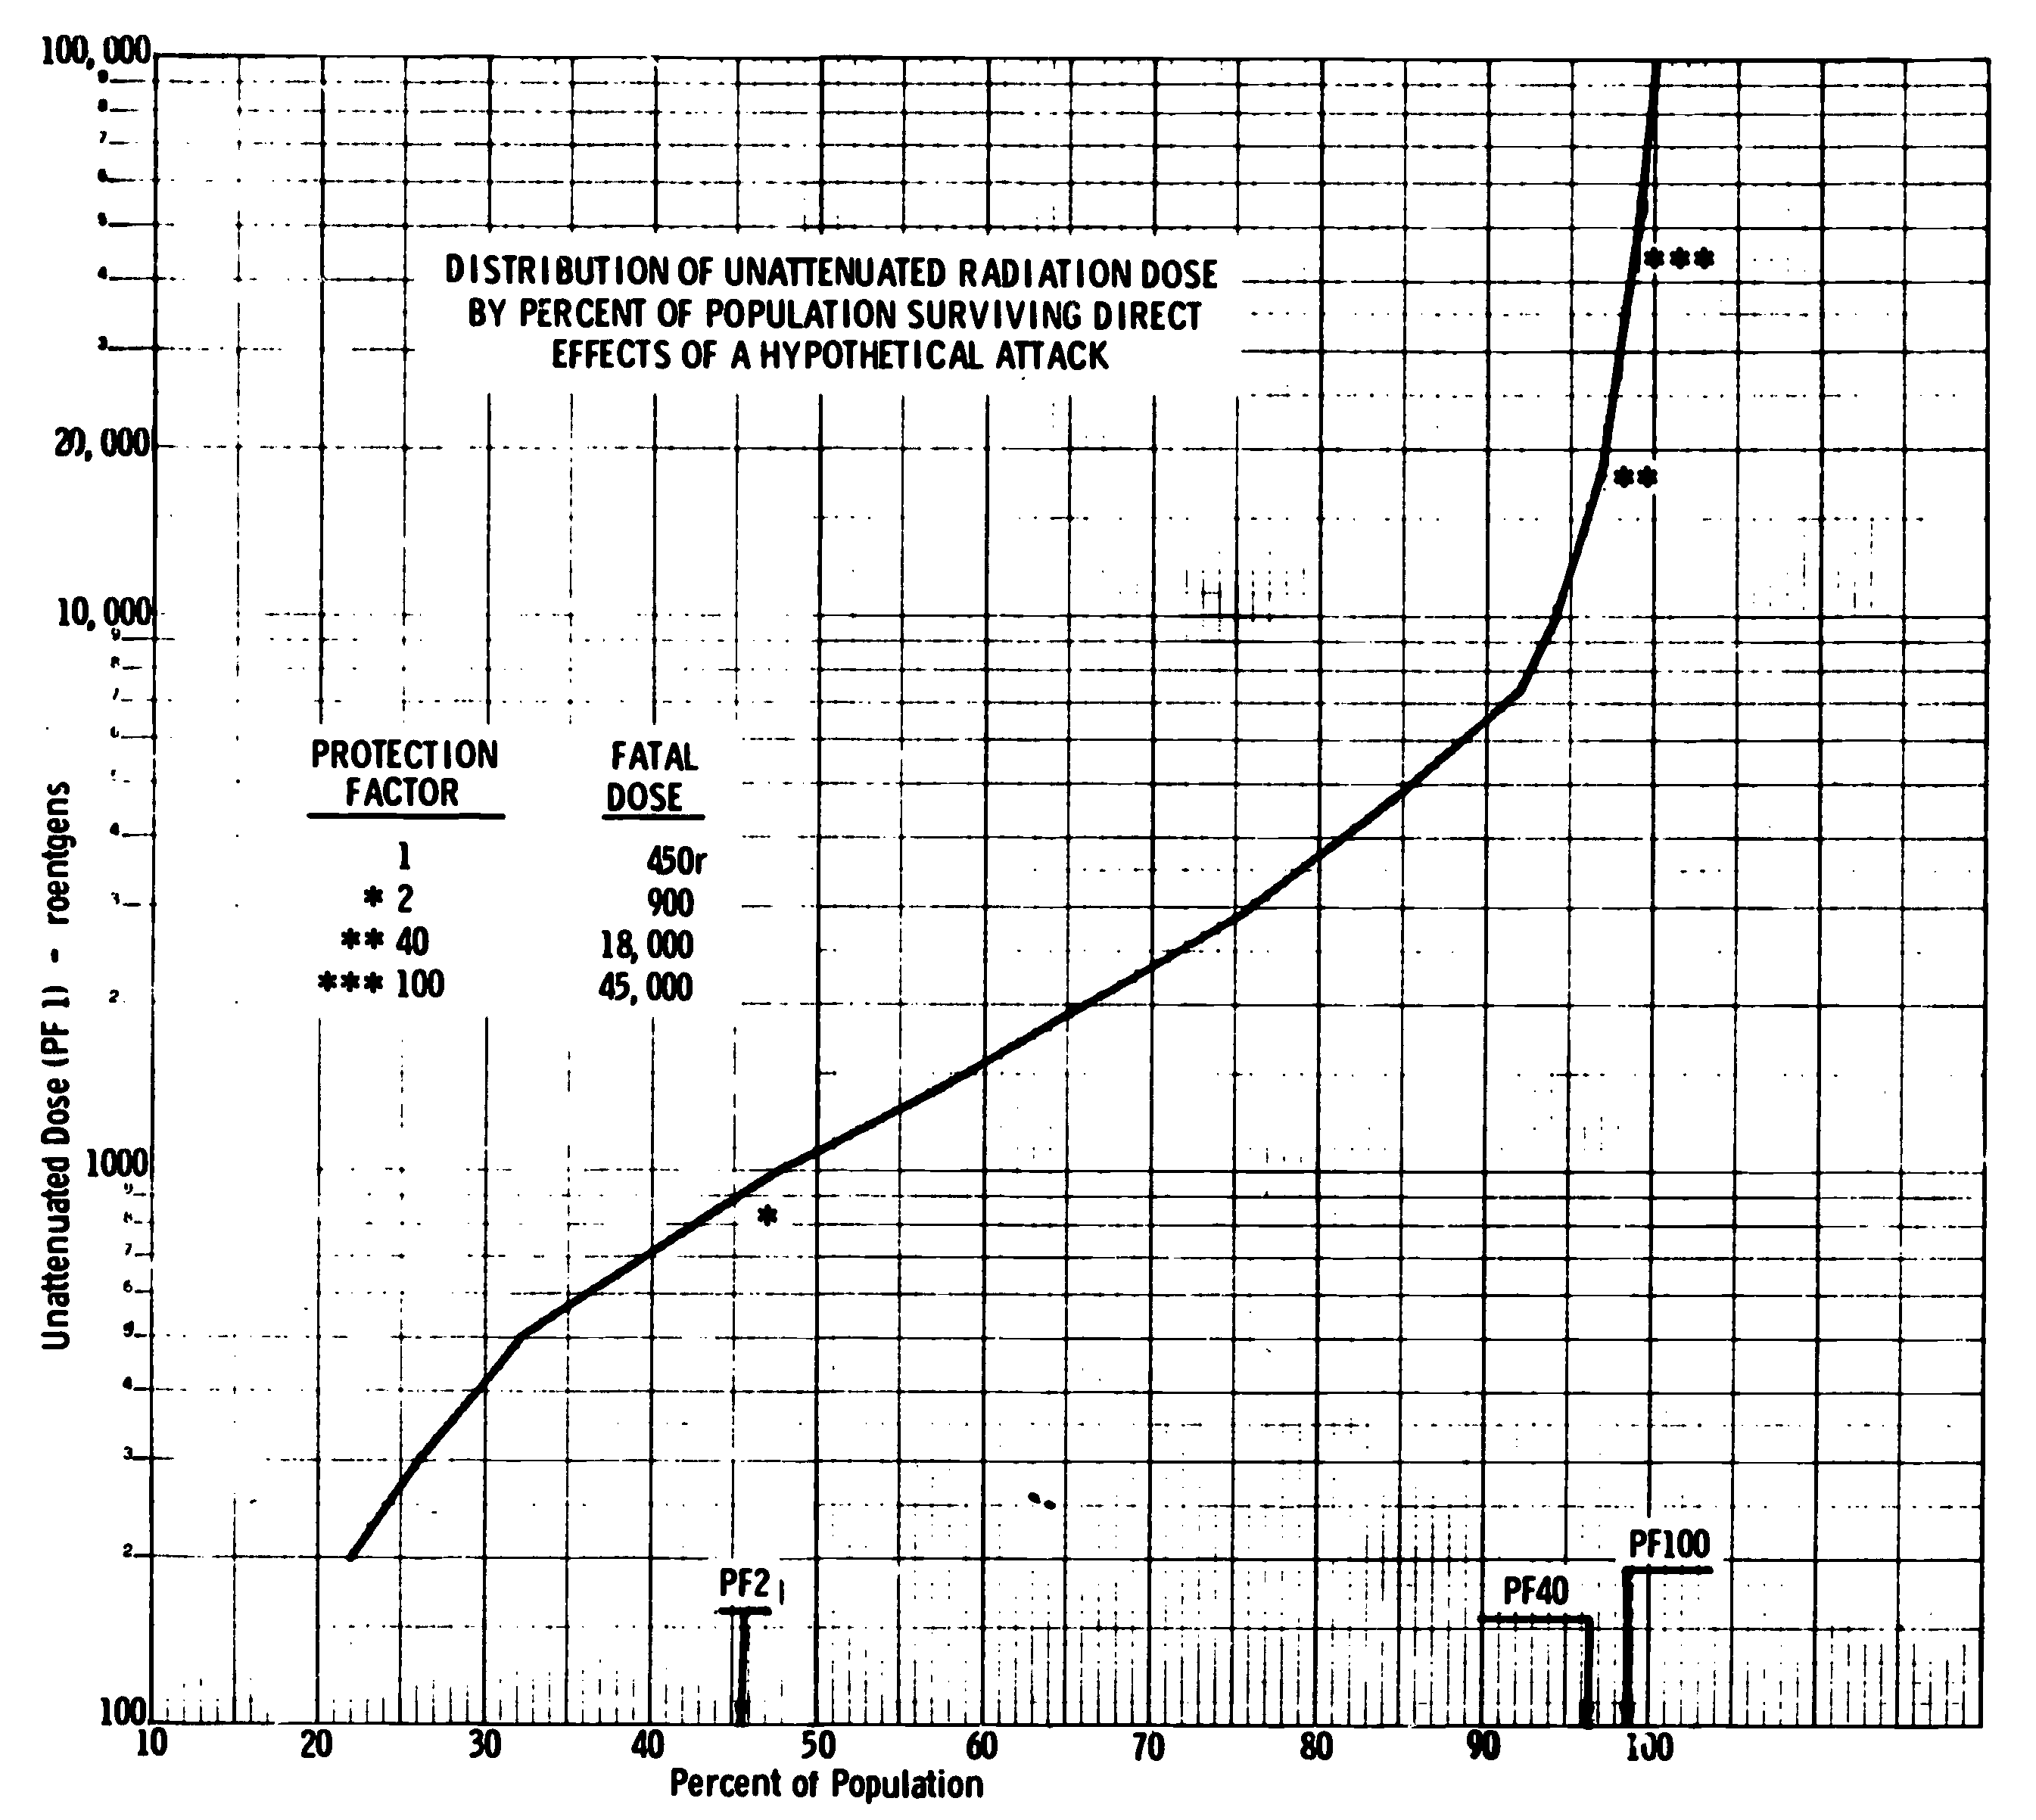
Across the horizontal scale on Figure 12, is the percent of the population who survived the initial effects of the attack; i.e., blast and immediate fire. Up the vertical scale are the outside dose rates to which this population would be exposed. There are several checkpoints asterisked.
Fig 12 – DISTRIBUTION OF UNATTENUATED RADIATION DOSE BY PERCENT OF POPULATION SURVIVING DIRECT EFFECTS OF A HYPOTHETICAL ATTACK
|
First, the little inserted table. Protection factor 1 means no protection. The fatal dose, the 50-50 median lethal dose, is 450 roentgens. With protection factor 2, the assumed protection you would get from hilly terrain, buildings blocking off the area—in other words, breaking up the theoretical fallout plane—a 900 roentgens dose would be the 50-50 median lethal dose.
With a protection factor of 40, 18,000 roentgens becomes the median lethal dose. With a protection factor of 100, 45,000 roentgens.
Now, let’s look at Figure 12 again. About 45 percent of the population would survive if they were given PF 2. This is what we think would happen, normally, without any action at all.
Buildings and terrain differences provide protection factor 2. Now, this is 45 percent of the population that’s already survived the attack. And this is comparable to the group of people in those bar charts that are exempt from fallout or from damaging levels of fallout. Now, the remainder of the people—if you go all the way to 100 PF it is 98.5 percent. In this same kind of attack we’ve been dealing with a heavy attack against population—98.5 percent of the population would survive if they had 100 protection factor; that is 98.5 percent of those who had survived the blast. With a 40 PF, it is about 96.5 percent. Now what we’re dealing with is two percent of the population between protection factors 40 and 100. For those not familiar with our protection factor connotations PF 40 means that it’s 1/40th of the outside dose, that is 2.5 percent of the unattenuated dose. PF 100 is 1/100th of the outside dose, or 1 percent.
In our current program, we have been marking and stocking shelters with a protection factor of 40. Our shelter plan calls for use of the best protection available. Use the best you have, but remember PF 40 will do a real job. And the reason for PF 40 is, we don’t want to give up the tremendous asset that exists between protection factor 40 and 100. So the argument is about a two percent difference in population, but we know that these calculations have at least a two percent error in them, and so, 40 PF is not significantly different from 100 PF.
This is why we make our public pronouncements that well over 90 percent of the people who would otherwise die would be saved by 40 PF.
Figure 13 shows the distribution of the shelter assets as of January 25, 1966. Notice the six digit accuracy. This is shown by our regions. I’m sorry I don’t have a map along to show you which these are. If you’re not familiar with them, 1, 2, and 3 are down the East Coast, 4, 5, and 6 Central, and 7 and 8 on the West Coast.
|
Fig. 13 – SHELTER SPACES NATIONAL FALLOUT SHELTER SURVEY AS OF JANUARY 25, 1966 |
|||
|
OCD REGIONS |
TOTAL SHELTER SPACES (000) |
SHELTER SPACES WITH PF 40-99 (%) |
SHELTER SPACES WITH PF 100 AND MORE (%) |
|
1 |
47,007 |
36 |
64 |
|
2 |
28,582 |
39 |
61 |
|
3 |
10,373 |
49 |
51 |
|
4 |
21,771 |
33 |
67 |
|
5 |
8,321 |
47 |
53 |
|
6 |
10,011 |
42 |
58 |
|
7 |
11,850 |
40 |
60 |
|
8 |
3,773 |
33 |
67 |
|
TOTAL |
141,688 |
39 |
61 |
About a third of all the shelter space we have found, ranges between the PF 40 and 99. The median protection factor of that group is close to 60 PF. It changes and is presently calculated as 67. For the shelter spaces with PF 100 or more, the median is PF 260. Our survey has found some very good space. About one-eighth of the total space is over 1,000 PF. So we have a wide range of protection. We feel that anything down to 40 PF—and if you don’t have PF 40, something close, will save significant numbers of people.
As our program progresses, we propose to identify the space in relation to people. We’re initiating this year, after a three-year series of experiments, a community shelter planning program which will identify, with geographic precision, where our shelter deficits are, where our follow-on program should be applied, and where the inclusion of the kind of shelter in new construction that Jim Roembke has developed for us should be applied.
And that’s the gist of our program. It can save lives, it’s feasible, and the protection is real. And it’s available, at the lowest cost of any defense program so far designed.
Distribution:
OCD Regions, Staff College
State and Local CD Directors
Defense Coordinators of Federal Agencies
Qualified Fallout Shelter Analysts
Libraries
CE-BuDocks Field Offices (District Engrs. and Public Works Offices)
State Military Support Planning Officers