Chart 1
|
NOV. 1963
DEPARTMENT OF DEFENSE
|
The major requirement of the civil defense effort today must be to limit damage from large nuclear attacks and lay a base for the earliest possible national recovery. Therefore, assumptions must be developed as to the characteristics and scope of possible attacks.
The Department of Defense has "war-gamed" a large number of different types and sizes of possible nuclear attacks over the last two years. These systematic and detailed studies were made for many purposes: analysis of military strategy, evaluation of new weapons systems development and civil emergency planning. The targetting was done principally by the staff and agencies reporting to the Joint Chiefs of Staff.
The attacks covered different combinations of military, urban-industrial and population targets with various mixes of airbursts and groundbursts and sizes of weapons. The following target systems were included: population centers, industrial complexes, communication focal points, offensive airfields, submarine bases, ICBM sites, nuclear storage sites, military control centers, defensive bases, and seats of government. Other variables include such matters as how war starts, enemy abort rates from malfunctions, attrition of incoming weapons from U. S. military action, duration of attack, weapons accuracy, and upper wind direction and velocity. In evaluating shelter potential, allowances were made for failure of some people to get into available shelters and for poor use of shelters by part of those who do get in.
The following sequence of charts and maps present the results of these studies.
– – – – – – – – – – – – – – – – – – – – – – – – – – – – – – – – – – – – – –
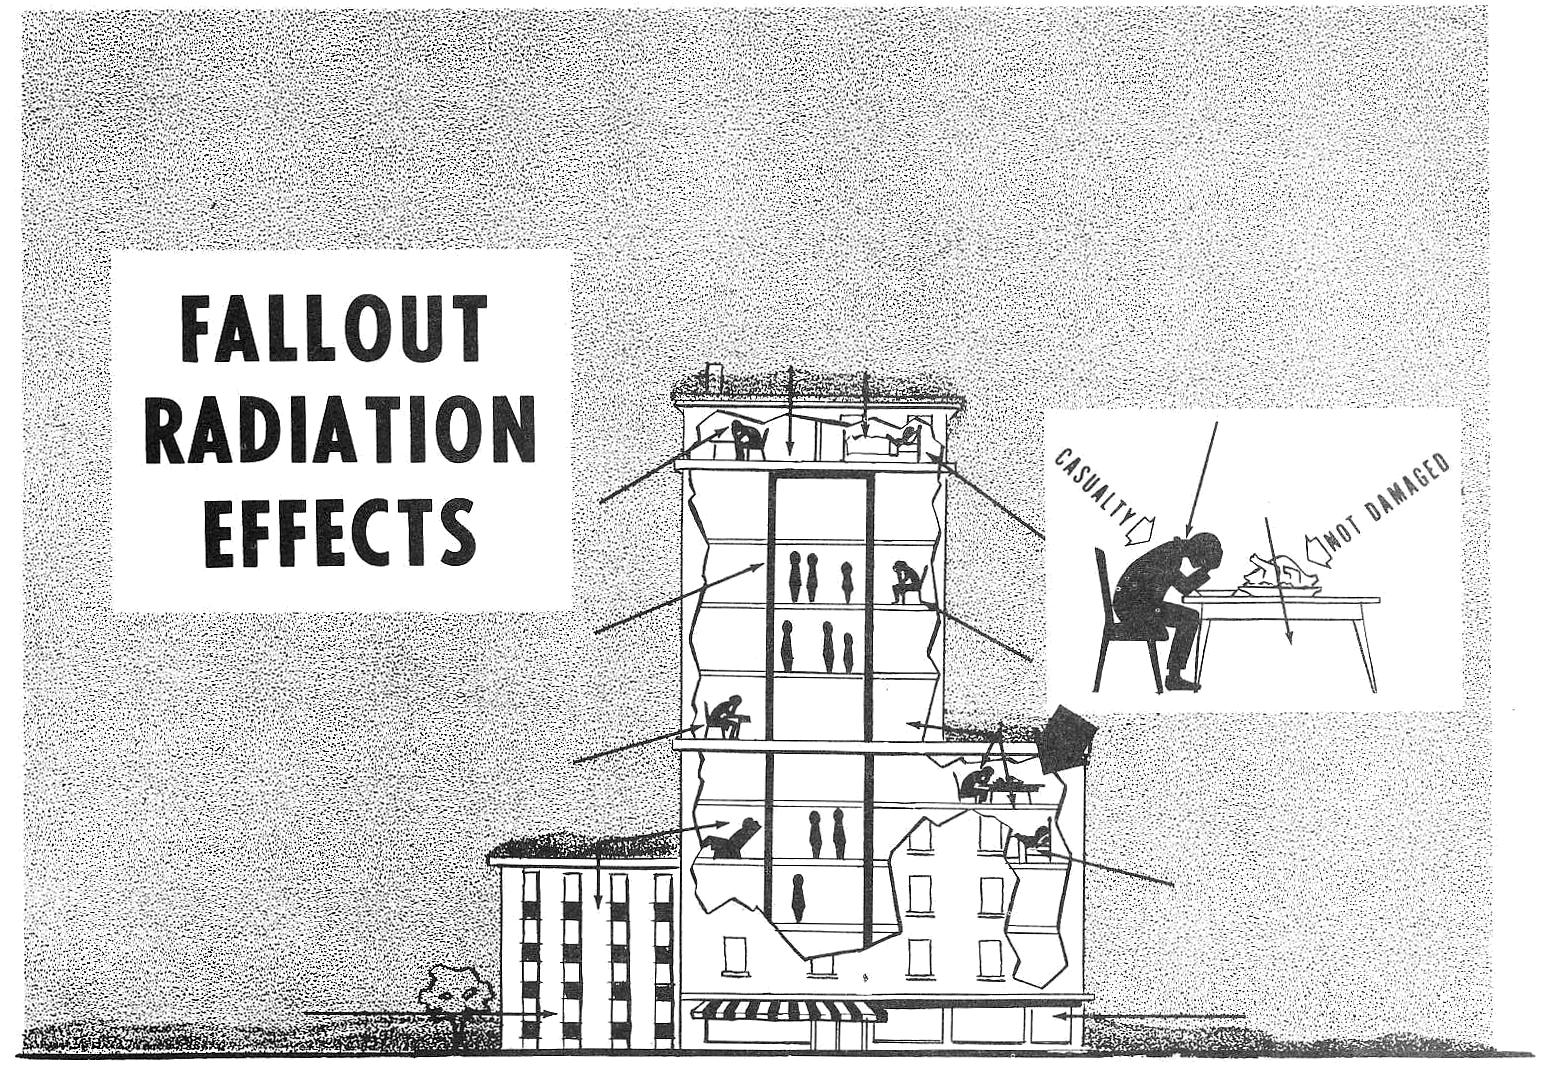
This chart illustrates the effects of fallout radiation upon occupants of a typical 10-story commercial building.
A few facts about the physical nature of fallout:
1. The fallout particles are like salt or sand; they have weight and settle on the ground; they are not likely to be indoors in harmful amounts.
2. Food is not contaminated unless outdoors and covered by fallout particles; the particles can be removed by washing or peeling.
3. Water from many sources is protected by passing through the ground and by water purifying systems; unprotected water can be decontaminated in many water systems.
4. Gamma radiation decays rapidly -- roughly to 10% in 7 hours and to 1% in two days; but in some areas radiation intensity could require shelter occupancy for as long as two weeks.
In the chart, arrows represent the damaging gamma radiation from fallout particles. The arrows show radiation penetrating the outside walls, injuring persons in the outer rooms. Some radiation would penetrate the protective core area of the building, but the density of building material would reduce the radiation to levels doing little or no harm.
To the right of the building are pictured the initial effects of too much radiation on the human body; destruction of body cells is taking place soon to result in intense illness. Depending on the amount of the dose, death could follow days or weeks later. However, the same radiation is shown passing through food without contamination or damage.
Chart 1
|
– – – – – – – – – – – – – – – – – – – – – – – – – – – – – – – – – – – – – –
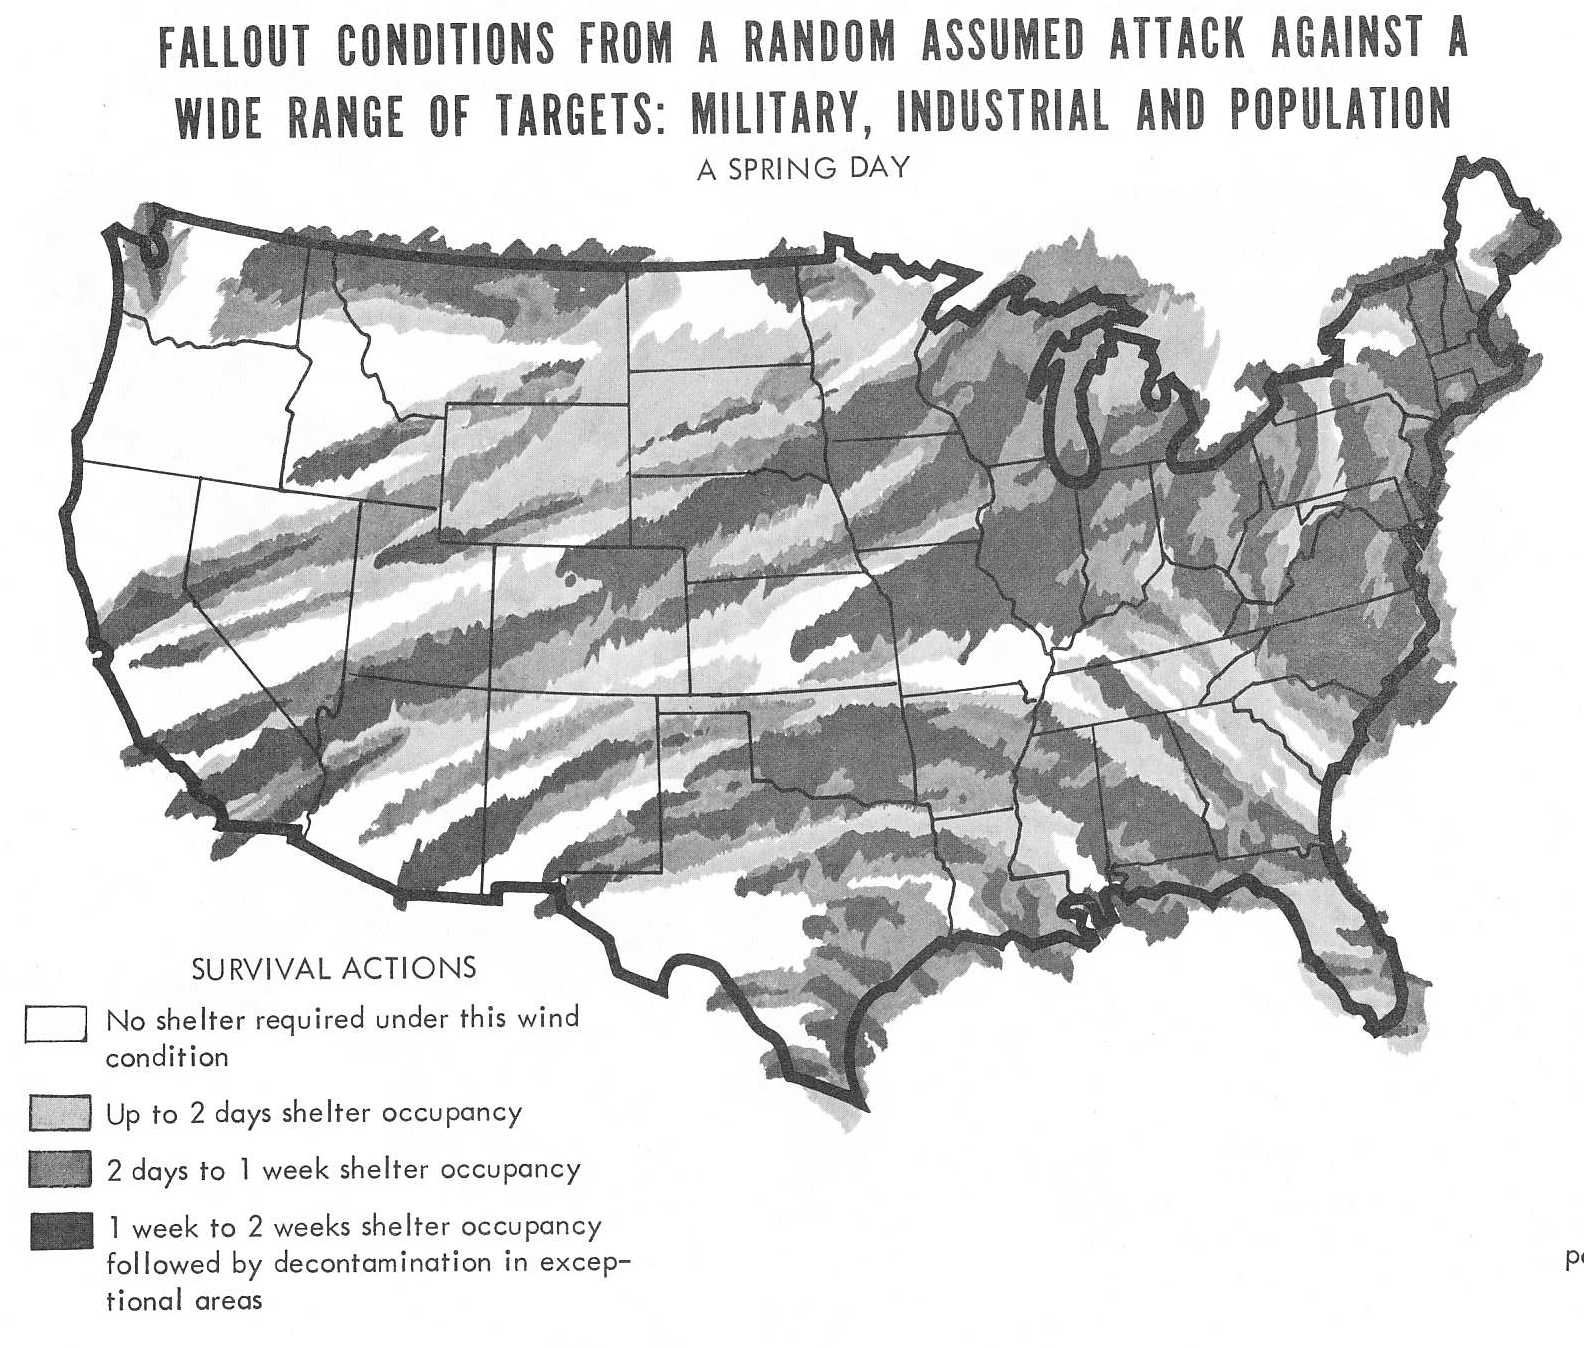
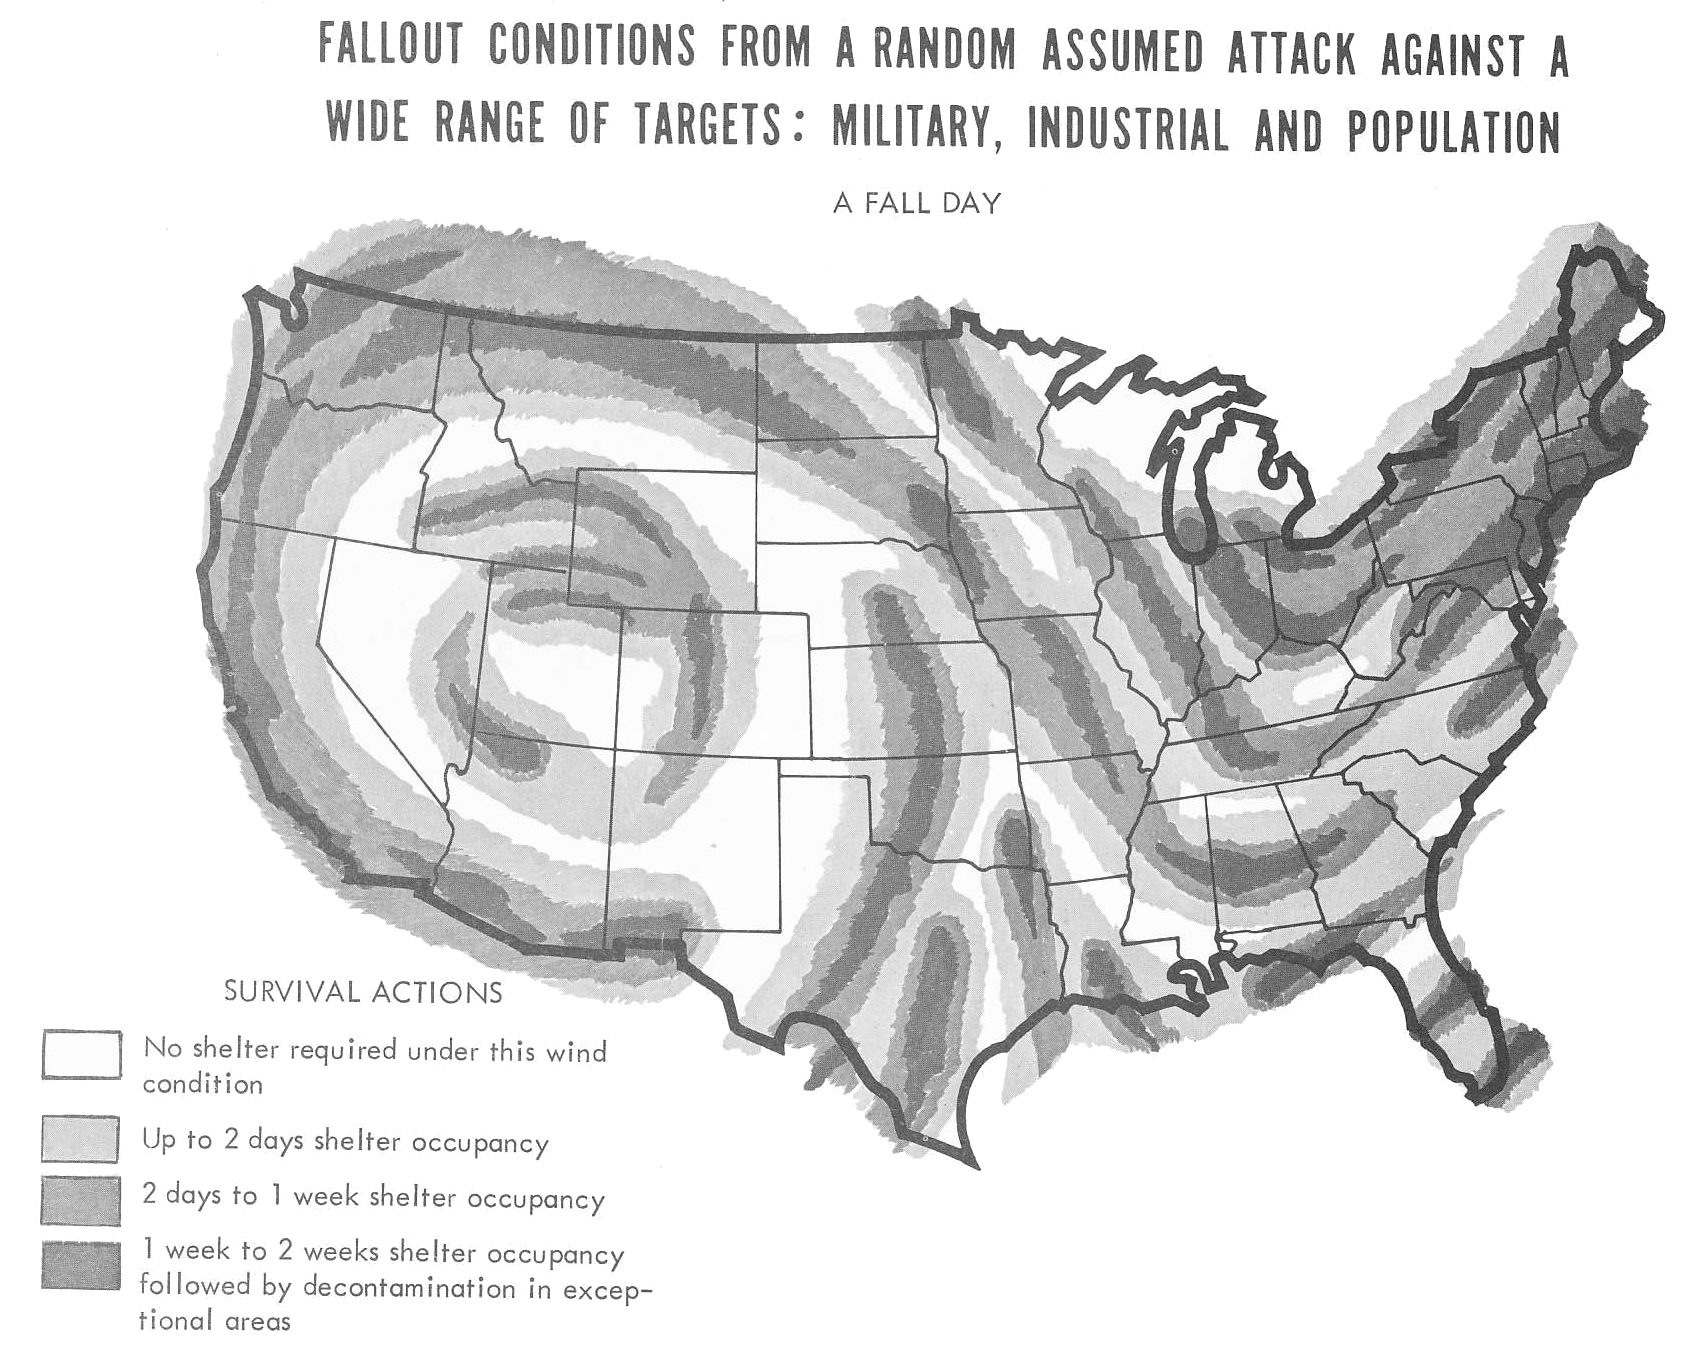
Charts 2 and 3 show the geographic distribution of various levels of radioactivity resulting from an assumed attack, against cities, industry and military targets. The attack was programmed on a random basis for both the time of the year and the targets attacked. The facing map shows fallout distribution by winds of one spring day; the second map by winds of one fall day.
The level of attack is in excess of 5,000 megatons detonated on target, about 65% surface bursts which generate fallout.
About 75% of the land would be covered with lethal or dangerous levels of radioactive fallout if average winds prevailed. Areas shown to be free of serious fallout could virtually all be covered under different wind conditions.
The darkest areas show a week to two weeks stay in shelters. Less dark areas would require two days to one week. The light gray areas would require shelter only for the first day or two.
Chart 4 compares the effects of fallout and blast on the population and the land area of the country using attack assumptions similar to Charts 2 and 3.
Chart 2 – FALLOUT CONDITIONS FROM A RANDOM ASSUMED ATTACK AGAINST A WIDE RANGE OF TARGETS: MILITARY, INDUSTRIAL AND POPULATION – A SPRING DAY
|
Chart 3 – FALLOUT CONDITIONS FROM A RANDOM ASSUMED ATTACK AGAINST A WIDE RANGE OF TARGETS: MILITARY, INDUSTRIAL AND POPULATION – A FALL DAY
|
CHART 4 – EXPOSURE TO BLAST AND FALLOUT HEAVY HYPOTHETICAL ATTACK ON CITIES INDUSTRY AND MILITARY TARGETS |
||
|
POPULATION |
RADIATION LEVELS |
AREA |
|
60% |
Lethal Radiation |
37% |
|
25% |
Dangerous |
37% |
|
15% |
Exempt or Tolerable |
26% |
|
POPULATION |
BLAST LEVELS |
AREA |
|
21% |
Near Total Destruction |
0.5% |
|
18% |
Heavy Damage |
1.5% |
|
20% |
Moderate to Light Damage |
8% |
|
41% |
No Physical Damage |
90% |
|
* – Pounds per square inch of blast pressure |
||
– – – – – – – – – – – – – – – – – – – – – – – – – – – – – – – – – – – – – –
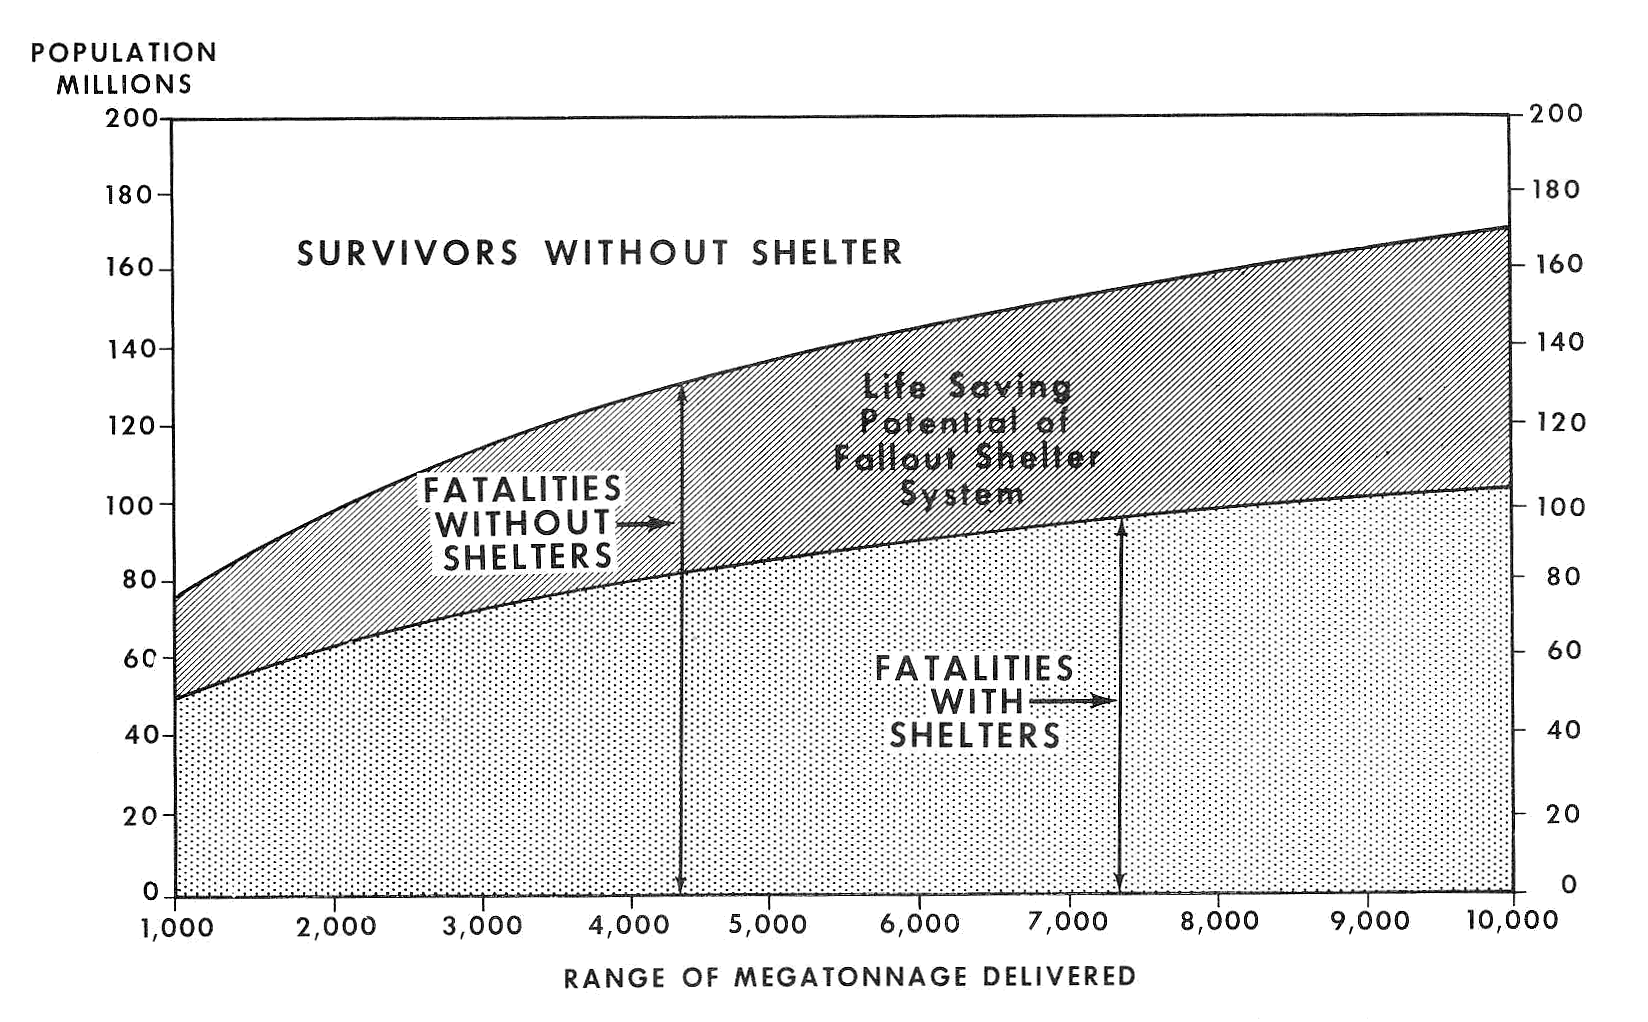
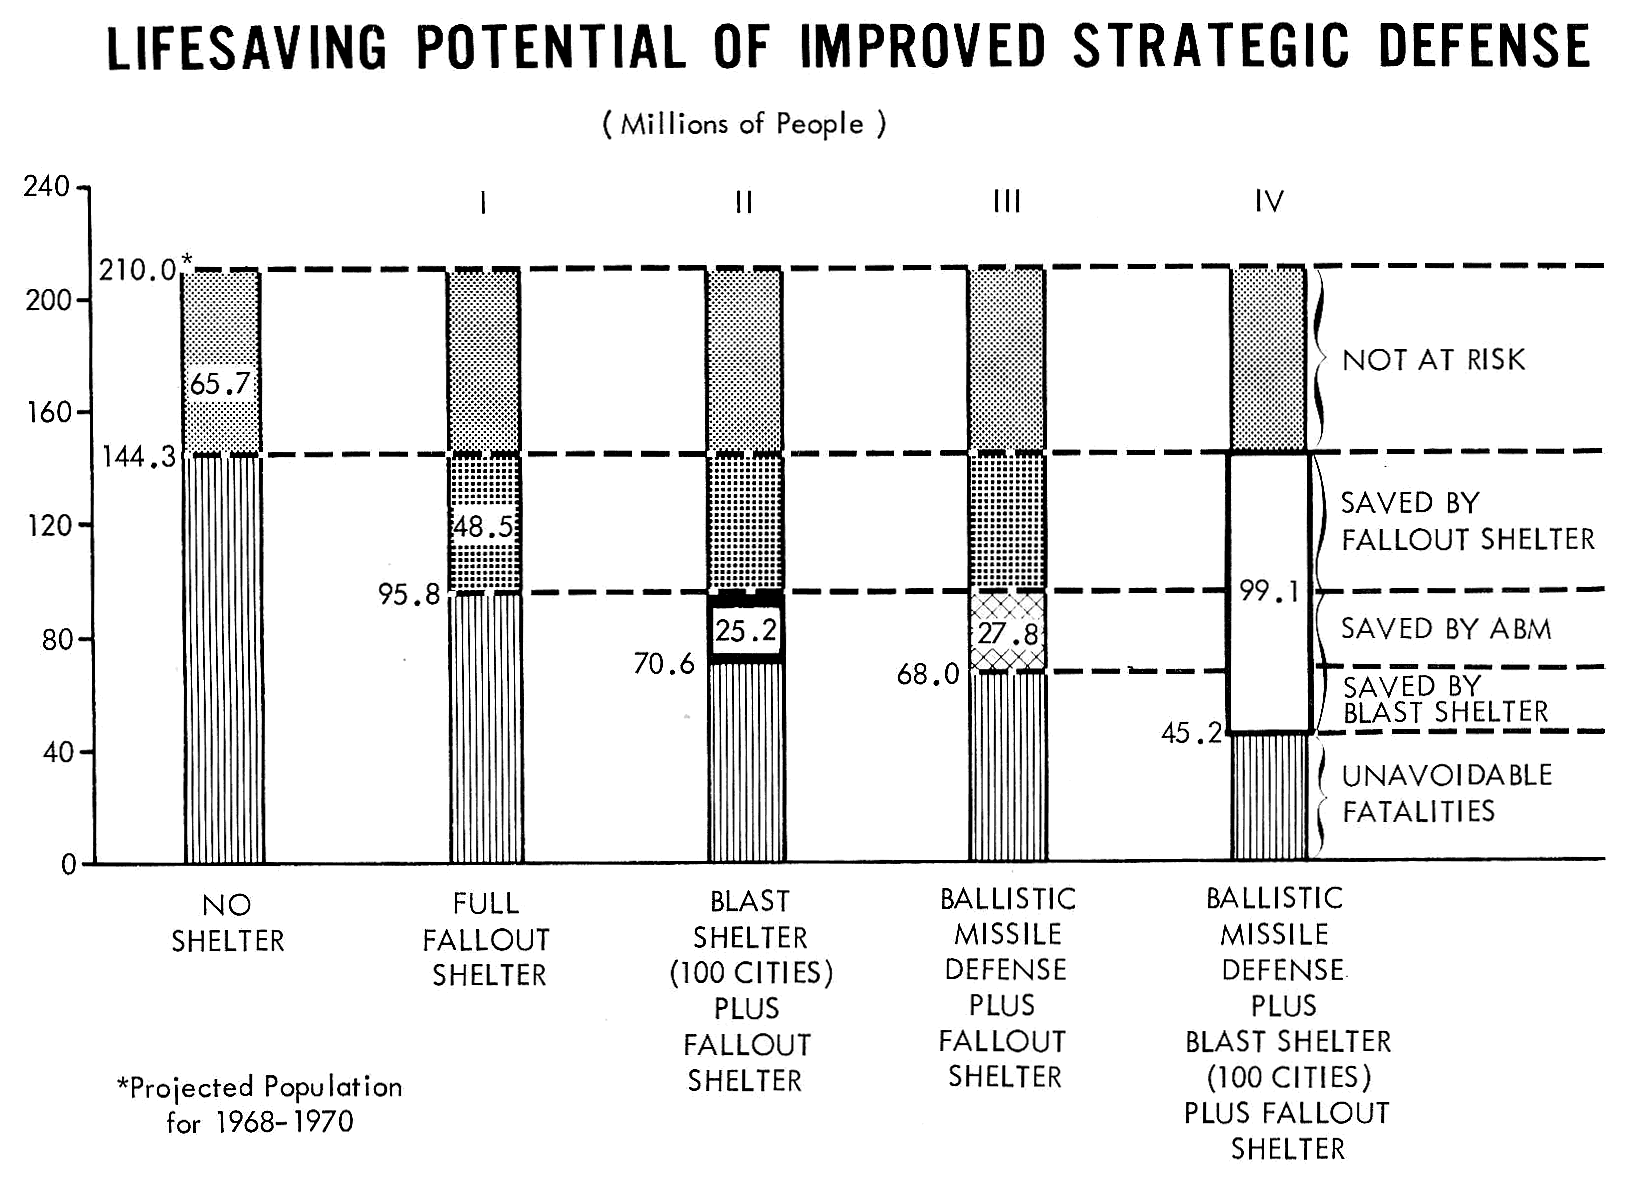
The chart opposite shows the composite results for attacks, based on the assumptions given on the introductory page, designed to maximize damage to targets of all types, including cities.
Tens of millions of lives would be saved by a full fallout shelter system; lives saved increase as the level of attack rises.
About half the lives saved by fallout shelters would be in urban areas (cities of over 50, 000 people) and the other half in small towns and rural areas.
The proportion of the population surviving solely because of fallout shelters becomes critical to the national recovery potential as attacks become heavier:
Shelters almost double survivors at the middle of the chart (60 million survivors increased to 110 million).
Shelters more than treble survivors at the right of the chart (30 million survivors increased to 100 million).
Chart 5 – LIFE SAVING POTENTIAL OF FALLOUT SHELTER SYSTEM IN ATTACKS AGAINST MILITARY-URBAN-INDUSTRIAL TARGETS
In event of attacks against military targets alone, total fatalities would be reduced and life saving potential of shelters would be increased. SOURCE: Composite of damage assessment studies by Department of Defense |
– – – – – – – – – – – – – – – – – – – – – – – – – – – – – – – – – – – – – –
Level of Attack.
In excess of 5000 MT delivered, 65% surface burst.
Shelter Conditions - for projected population of 210 million.
Fallout protection - 240 million fallout shelter spaces to cover people at work and at home.
Blast shelter in 100 cities plus fallout elsewhere:
130 million blast shelter spaces (30 psi protection in central areas of cities; 10 psi in suburbs), plus
100 million fallout shelter spaces.
Shelter Assumptions
Some people will not take shelter - 10% of population fail to use available shelter.
Many people will make poor use of shelters - come in late, spend too little time in shielded areas.
Increasing population shift to urban areas - 18% shift by end of decade.
Certain factors not included for lack of adequate data offset each other:
Blast protection afforded by fallout shelters, buildings, terrain and other local characteristics.
Fatalities from fire spread beyond the impact area.
Ballistic Missile Defense
22 cities protected at a 5-year cost of $18 billion.
(Arbitrarily selected median of various studies of hypothetical systems ranging from 20 to 25 cities defended and costs of $16 to $20 billion.)
– – – – – – – – – – – – – – – – – – – – – – – – – – – – – – – – – – – – – –
The table opposite presents comparative cost estimates of providing different levels of defense against the effects of nuclear attack. The unit costs per person protected are estimated averages only. The estimates of total costs of each program assume that the program will be realized by the late 1960s or early 1970s. The cost per life saved is obtained by dividing the total estimated cost by the total lives saved as shown in Chart 6.
LIFESAVING POTENTIAL OF IMPROVED STRATEGIC DEFENSE
|
The lowest cost program, with the greatest lifesaving return per dollar invested, would provide fallout protection for the entire population. In the other, more costly programs, major fallout protection would still be required, and would contribute most significantly to the total lifesaving potential of each system.
|
CHART 7 - ESTIMATED FEDERAL COSTS OF IMPROVED STRATEGIC DEFENSE |
Cost per Person Protected (Dollars) |
Cost per Life Saved (Dollars) |
Total Cost ($ Billion) |
|
|
I |
Nationwide Fallout Protection |
11.20 |
48 |
2.35* |
|
|
----Survey of dual purpose fallout shelter |
(1.20) |
(4) |
(0.11) |
|
|
----New dual purpose fallout shelter |
(22.40) |
(103) |
(2.24) |
|
II |
Blast shelter in 100 cities with fallout protection elsewhere |
89.30 |
255 |
18.75 |
|
III |
Ballistic missile defense, with nationwide fallout protection |
96.90 |
266 |
20.35 |
|
IV |
Ballistic missile defense, with 100 city blast protection and fallout protection elsewhere |
175.00 |
371 |
36.75 |
|
* – This buys 240 shelter spaces to meet requirements of working and home population. The difference from earlier studies estimating total costs at about $20 billion results from maximum use of shielding from radiation provided by normal construction with minor modifications, if necessary. |
||||
– – – – – – – – – – – – – – – – – – – – – – – – – – – – – – – – – – – – – –
The current intense interest in the development of an anti-ballistic missile system has brought into sharp focus the priority of a fallout shelter system in relation to other defense requirements. In his recent military posture hearings. Secretary McNamara said:
"The effectiveness of an active ballistic missile system in saving lives depends in large part upon the existence of an adequate civil defense system. Indeed, in the absence of adequate fallout shelters, an active defense might not significantly increase the proportion of the population surviving an all-out nuclear attack. For this reason, the very austere civil defense program recommended by the President, which I will discuss later, should be given priority over any major additions to the active defenses. "
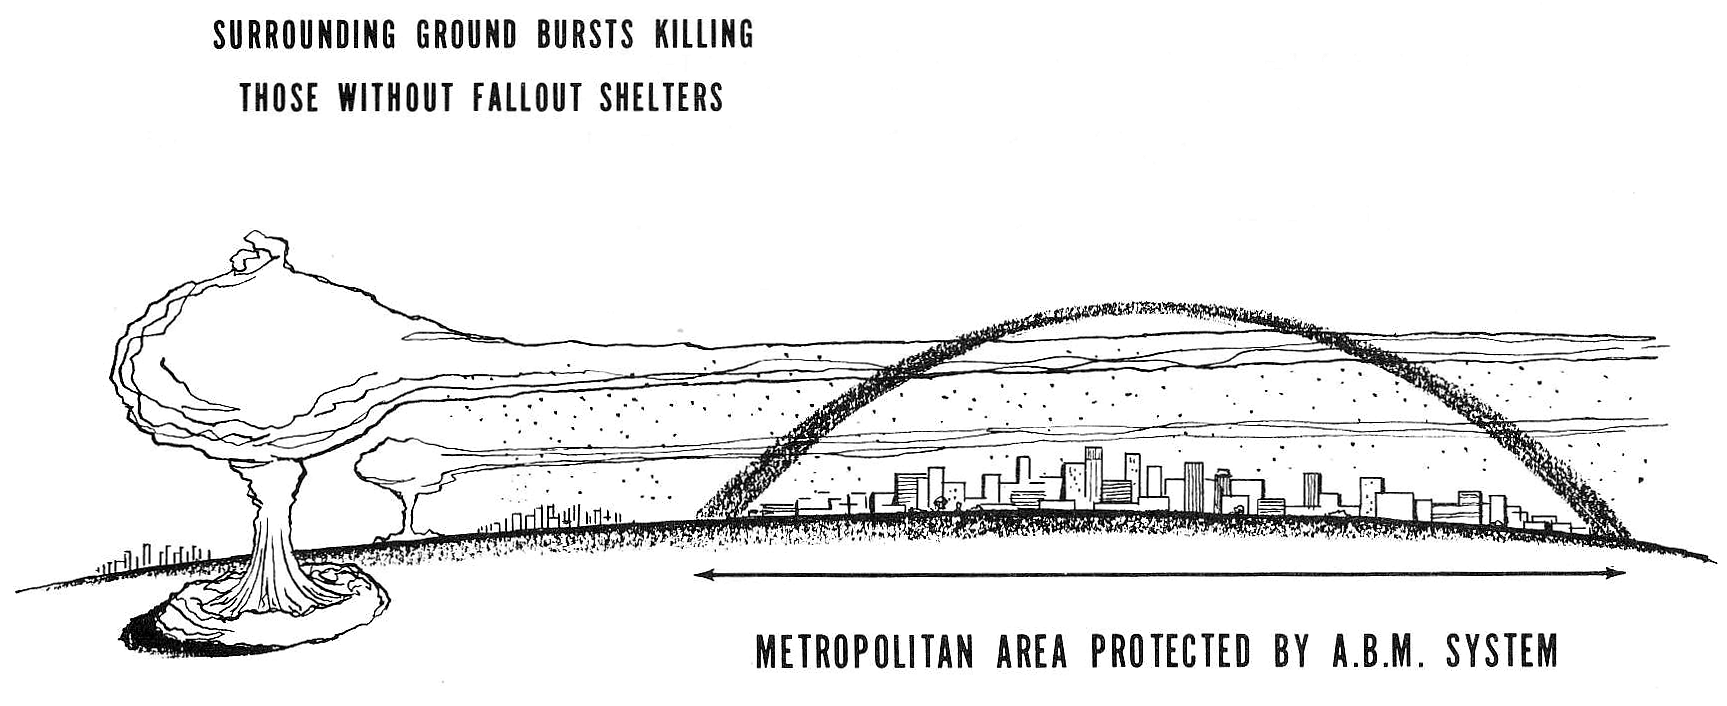
This chart depicts the relationship between anti-ballistic missile systems and shelters. While shelters have value with or without an anti-ballistic missile system, an anti-ballistic missile system has little value for the protection of population without shelters for two reasons:
First, the people in areas protected by ABMs can be exposed to lethal fallout radiation even though enemy weapons do not penetrate the protected areas. Surrounding groundbursts, as illustrated on the left of the chart, could be targeted to kill those without fallout shelters in a city.
Second, a series of industrial and population centers protected by effective anti-ballistic missile systems (which have yet to be developed) may result in a shift in targeting to unprotected industrial and population centers. Although lower priority, the unprotected target areas may be fully justified by military, psychological and deterrent objectives.
The relationship of shelters and anti-ballistic missile systems illustrates the necessity for integrating civil defense and other defense programs. Maximum protection of our people and values is the purpose of all of our defense efforts. This objective requires a balanced and coordinated mix of civilian and military defense systems.
Chart 8 – ANTI - BALLISTIC MISSILE SYSTEM AND SHELTERS
|
– – – – – – – – – – – – – – – – – – – – – – – – – – – – – – – – – – – – – –
The upper section of the facing chart sets forth the funding requirements for the two programs requiring authorization. The legislative authorization for these programs is contained in H.R. 8200 which passed the House on September 17, 1963, and is currently being considered by the Senate Armed Services Committee.
The lower section of the chart provides a three year comparison of funds related to programs currently authorized.
CHART 9 – OFFICE OF CIVIL DEFENSE – FUNDING SUMMARY – IN MILLIONS |
||||
|
PROGRAMS REQUIRING AUTHORIZATION (1) |
FY1962 Obligations |
FY1963 Appropriation |
FY 1964 – Budget Request |
FY 1964 – Senate Allowance |
|
Shelter Development in Facilities of Non-Profit Institutions and State & Local Governments |
|
|
$175.0 |
|
|
Incorporation of Shelter by Modifications to Existing Federal Buildings |
|
|
15.6 |
|
|
Total |
|
|
$190.6 |
|
|
(1) – Authorization for these programs is contained in H.R. 8200 which has passed the House and is currently pending before the Senate. |
||||
|
AUTHORIZED PROGRAMS |
FY1962 Obligations |
FY1963 Appropriation |
FY 1964 – Budget Request |
FY 1964 – Senate Allowance |
|
Shelter Survey |
$ 58.4 |
$ 9.3 |
$ 7.8 |
$ 7.8 |
|
Shelter Provisions |
90.2 |
32.7 |
46.9 |
46.9 |
|
Shelter in Federal Buildings (2) |
17.5 |
|
|
|
|
Research and Development |
19.0 |
11 .0 |
15.0 |
10.0 |
|
Operation and Maintenance |
64.9 |
75.0 |
82,2 |
70.6 |
|
Total |
$250.0 |
$128.0 |
$151 .9 |
$135.3 |
|
(2) – In addition, some shelter has been provided in new construction appropriations to other federal agencies. In 1960 and 1961, $465,000 was appropriated for shelter in National Bureau of Standards buildings at Boulder, Colo., and Gaithersburg, Md. During 1961-1963, $3,160,000 was requested by the Veterans Administration for shelter and this sum was appropriated by Congress; however, these funds were not expended for shelter in view of the restrictive language in Section 303 of the annual Independent Offices Appropriations Acts for these years. |
||||
– – – – – – – – – – – – – – – – – – – – – – – – – – – – – – – – – – – – – –
RESULTS -
1. Shelter found for 104 million people in over 125,000 buildings, caves, mines and tunnels, exclusive of space excess to local needs.
2. Shelter for 70 million people estimated to be available with consent of owners.
3. Shelter for about 54 million people licensed by owners of over 60,000 buildings as of November 6, 1963.
4. Shelter for about 54 million people marked with public shelter signs as of November 6, 1963
5. 70% of shelter space is aboveground in inner core of multistory buildings.
6. Shelter for 31 million additional people available where needed by ventilating basement areas.
SCOPE -
1. 5 million buildings, caves, mines and tunnels with potential shelter space covered by survey.
2. Over 600 architectural and engineering firms employed , using over 2,000 graduates of shelter analysis courses.
3. Participating agencies: Army Corps of Engineers; Navy Bureau of Yards and Docks; Bureau of Census; Bureau of Standards.
– – – – – – – – – – – – – – – – – – – – – – – – – – – – – – – – – – – – – –
The Defense Department is supplying all shelters available to the public so that people can stay in them long enough.
The stocking system also provides an organized local capability for mass feeding and care of shelter occupants. It affords the lowest cost and widest coverage for national distribution of the essential elements for human survival.
$123 million of fiscal years 1962 and 1963 funds have been committed to provide shelter stocks for 50 million Americans. They include:
|
|
Cost Per Shelter Space |
|
Wheat-based biscuit and carbohydrate supplement: 10,000 calories per person |
$1.17 |
|
14 quarts of stored water per person |
-- |
|
Steel water containers and liners convertible to chemical toilets |
0.44 |
|
Medical kits for non-professional use |
0.25 |
|
Sanitation kits |
0.17 |
|
Radiation detection instrumentation |
0.18 |
|
Warehousing and transportation costs |
0.21 |
|
|
$2.42 |
The supply line to accommodate 50 million people consists of:
Volume equivalent to 50,000 boxcars transported over 20 million miles to 79 distribution federally operated warehouses
Schedules of 2,600 manufacturers and shippers
Storage space located and donated by over 100,000 building owners
Local management and installation of supplies by about 5,000 county and municipal governments
Stocks for 30.1 million shelter spaces have been ordered by local governments.
Shelter areas for 26 million people have been fully or partially stocked.
– – – – – – – – – – – – – – – – – – – – – – – – – – – – – – – – – – – – – –
This chart shows the distribution by cities and towns, of the 104 million shelter spaces located through the survey, and the 30.8 million spaces which could be added through ventilation improvements.
Surveyed shelter spaces for 59 million people are in the 24 largest metropolitan complexes, meeting a large part of the daytime and night-time population requirements. Nearly 45 million spaces are in the rest of the cities and towns, fairly well distributed.
Ventilation of basements alone, at costs averaging about $12 per person sheltered on a national basis, would substantially reduce the shelter deficiency, particularly in the smaller cities and towns. For example, shelter found in towns of under 50,000 and rural areas would be increased about 70% by ventilation.
Chart 10 – DISTRIBUTION OF USABLE SHELTER SURVEY SPACES By Cities and Towns |
||||
|
SIZE OF CITIES AND TOWNS |
POPULATION (Millions) |
SURVEYED SHELTER SPACE (Millions) |
SHELTER SPACE WHICH CAN BE ADDED BY VENTILATION (Millions) |
|
|
1960 RESIDENT |
PEAK |
|||
|
OVER 1,000,000 |
61.5 |
78.0 |
59.2 |
9.4 |
|
250,000 TO 1,000,000 |
35.0 |
40.7 |
20.8 |
6.3 |
|
UNDER 250,000 AND RURAL |
85.5 |
88.8 |
24.0 |
15.1 |
|
TOTAL |
182.0 |
207.5 |
104.0 |
30.8 |
|
Includes Population of the Central City and Adjoining Areas which are Socially and Economically Integrated with the Central City |
||||
– – – – – – – – – – – – – – – – – – – – – – – – – – – – – – – – – – – – – –
The shelter survey has defined opportunities to add a large amount of low-cost shelter space to the national inventory by identifying both the location of existing shelter space and potential improvements to add shelter. Most of the municipalities and counties in the country are now in a position to know where new shelter space is needed and how to create it at relatively low cost. Federal financial help is needed to take full advantage of the survey results. This is the next logical step in the progressive development of a moderate civil defense program.
It is proposed to authorize and make available federal financial contributions not exceeding $175 million during FY 1964 to stimulate communities to add to locally available fallout shelter space in the buildings of schools, hospitals, state and local governments and other non-profit institutions. It is estimated that this amount would be fully used up by the lowest cost opportunities to create new shelter space.
Federal financing would be limited to $2.50 per square foot, or actual cost, whichever is lowest ($25.00 per person sheltered). Only costs allocable to the creation of new shelter space would be allowed. Virtually all of the shelter space thus created would be primarily used for peacetime purposes and only incidentally as public shelters. Because the survey has identified very low-cost opportunities for new shelter space through ventilation of basements and other minor improvements, the average federal cost for the first year of this program is estimated at $16. 35 per shelter space. Shelter for over 10 million persons is anticipated.
The limited amount of the federal payment, combined with intensive servicing, education and training of architects and engineers, is expected to stimulate increasing ingenuity in finding the lowest cost methods of meeting local shelter deficiencies.
The new shelter space thus developed, while small in comparison to the results of the survey, will be of special importance in meeting the national shelter requirement. From this new shelter will come the first experience with an austere program of federal financial assistance, depending on local initiative, planning, and in some cases, local financial participation. Planning for the best utilization of new and existing shelters will strengthen the organization of civil defense and the organization of community effort to provide minimal protection for the entire community.
The result of a year of such experience will provide a basis for more accurately assessing the requirements of federal financial assistance. The facing chart is an estimate of how $175 million would be applied to the three main categories of low-cost opportunities to create new shelter.
CHART 11 – ELEMENTS OF THE SHELTER DEVELOPMENT PROGRAM |
|||
|
|
Cost (Millions) |
Cost Per Person Sheltered |
Persons Sheltered (Millions) |
|
1. Ventilation of basements in existing buildings (following specifications developed in the survey). |
$80.5 |
$11.90 |
6.7 |
|
2 Dual-purpose shelters incorporated into designs of new construction. |
54.6 |
25.00 |
2.2 |
|
3. Low-cost structural modification of existing buildings. |
39.9 |
22.50 |
1.8 |
|
Total |
$175.0 |
$16.35 |
10.7 |
– – – – – – – – – – – – – – – – – – – – – – – – – – – – – – – – – – – – – –
The facing chart shows the planned FY 1964 program for incorporating fallout shelter through modifications to existing federal buildings.
First attention will be given in FY 1964 to exploiting low-cost opportunities identified by National Shelter Survey for increasing shelter capacity of existing structures located in or near those communities where the population to be sheltered exceeds the shelter space found through the survey. The minor improvements proposed include:
1. Ventilation Improvements - By installation of ventilation packages or improvements of existing ventilation systems, adequately shielded areas in many basements can be brought up to minimum OCD ventilation standards. It is proposed to use $8.6 million of FY 19 64 funds for this purpose, providing 745,000 additional shelter spaces at $12 per space average cost.
2. Shielding Improvements - Many areas contain structural characteristics which generally provide adequate shielding, but fail to meet OCD standards because of minor deficiencies, such as unprotected openings, which can be readily corrected. It is proposed to use $7.0 million of FY 1964 funds to correct these deficiencies, providing 308,000 additional shelter spaces at $23 per space average cost.
In addition to the modification funds proposed in the OCD budget, the construction agencies of the Federal Government have included $3,866,000 in their authorization proposals and budgets for shelter space in 58 new construction projects proposed for FY 19 64. It is estimated that shelter space for about 112,000 people can be obtained from these new construction projects. The authorizations and appropriations requests are based on the permissive Executive Branch policy of several years standing that shelter protective features, where appropriate and needed, shall be included as an inherent part of the design and construction process for new federal facilities. H.R. 8200, as reported by the Armed Services Committee, will embody into law the policy of the Congress that shelter shall be mandatory in all appropriate buildings, unless exempted from this requirement as being uneconomical, unnecessary, or impracticable. H.R. 8200, as reported, establishes the specific basis of exemption from the mandatory requirement.