This is a PARTIAL transcription due to time pressures. If you
wish to view the full version, CLICK HERE to view the original PDF file.
|
AUGUST 1960
TECHNICAL PAPER 50
Effects of Mass Fires on Personnel in Shelters
A. BROIDO AND A.W. McMASTERS
PACIFIC SOUTHWEST
FOREST AND RANGE
EXPERIMENT
STATION
BERKELEY - CALIFORNIA
FOREST SERVICE - U. S. DEPARTMENT OF AGRICULTURE
– – – – – – –
– – – – – – – – –
– – – – – – – – –
– – – – – – – – –
ACKNOWLEDGMENTS
The authors wish to acknowledge the contributions of the following
individuals and groups:
Mr. J. R. Murray, Forest Service instrument specialist, who
developed or modified much of the instrumentation.
Dr. M. Feldstein, Laboratory Director of the San Francisco Bay
Area Air Pollution Control District, who analyzed all of the bottled
gas samples.
Mr. A. B. Everts, U. S. Forest Service (retired), and Mr. Carl C.
Wilson, Chief, Forest Fire Research, Pacific Southwest Forest and
Range Experiment Station, who expedited the administrative
arrangements.
Personnel of the Los Angeles, Richmond, and El Cerrito Fire
Departments who made the tests possible in their respective cities.
Personnel of the East Bay Municipal Utility District, especially
Mr. William Hartman, Land Maintenance Superintendent, who cooperated
in the Briones Burn.
The many personnel of the Pacific Southwest Forest and Range
Experiment Station, the United States Naval Radiological Defense
Laboratory, the Camp Parks Fire Department, and the Santa Rita
Rehabilitation Center who assisted in the conduct of the Camp Parks
Burn.
– – – – – – –
– – – – – – – – –
– – – – – – – – –
– – – – – – – – –
EFFECTS OF MASS FIRES ON PERSONNEL
IN SHELTERS
By
A. Broido, Physical Chemist
and
A. W.
McMasters, Engineer
Division of Forest Fire Research
The material used in this report was developed under a research
contract (Contract No. DCM-SR-59-7) sponsored by the Office of Civil
and Defense Mobilization.
Technical Paper No. 50
August 1960
U. S. DEPARTMENT OF AGRICULTURE, FOREST SERVICE
PACIFIC
SOUTHWEST FOREST AND RANGE EXPERIMENT STATION
– – – – – – –
– – – – – – – – –
– – – – – – – – –
– – – – – – – – –
CONTENTS
INTRODUCTION
Importance of the Study
Past Work
Objective
Scope
INSTRUMENTATION
Methods of Drawing Samples
Temperature Measurements
Gas
Concentration Measurements
TEST FIRES
Los Angeles Tests
Richmond Tests
Briones Burn
El
Cerrito Rubble Probe Test
Camp Parks Burn
RESULTS
Los Angeles Tests
Richmond Tests
Briones Burn
El
Cerrito Rubble Probe Test
Camp Parks Burn
CONCLUSIONS
APPENDIX A - Human Tolerance of Various Fire Effects
APPENDIX B - Heat Transfer Computations
APPENDIX C - Ancillary Measurements at Camp Parks
LITERATURE CITED
FIGURES 37 - 84
– – – – – – –
– – – – – – – – –
– – – – – – – – –
– – – – – – – – –
EFFECTS OF MASS FIRES ON PERSONNEL IN
SHELTERS
By
A. Broido, Physical Chemist
and
A. W.
McMasters, Engineer
Division of Forest Fire Research
INTRODUCTION
IMPORTANCE OF THE STUDY
In the mass fires resulting from air attack during World War II,
many people lost their lives in shelters in fire areas (2, 9). The
greatest number of deaths occurred in basements or makeshift
shelters. In many cases, positions of the corpses indicated that
death came peacefully and unexpectedly. A frequent assumption is that
death was due to carbon monoxide poisoning. However, cause of death
has also been attributed to such effects as (a) asphyxiation
resulting from the depletion of oxygen either through conversion to
carbon dioxide or by suction created within the burning area, (b) the
effects of inhaling hot blasts of air, and (c) roasting of the
shelter occupants as a result of heat transfer into the shelter. The
confusion which still exists concerning the sources of hazard is
exemplified by the apparent inconsistency between reports of past
experiences and present practice in Germany. Although most reports
describing the great German fires of World War II list carbon
monoxide as the principal cause of death, current shelter plans of
the West German Government ignore carbon monoxide and call for sand
filters to remove heat from the ventilation air (13).
In the event of a nuclear attack on the United States, current
civil defense plans (24) call for the protection of large numbers of
our population in shelters. These may range from thick
reinforced-concrete blast shelters down to makeshift fallout shelters
in individual residences. Since nuclear detonations are expected to
produce large area fires (3), it is essential to consider the effects
of such fires on people taking shelter within the fire zone. Those in
heavy reinforced-concrete shelters located deep underground and with
an independent air supply will obviously not be affected by a fire
burning overhead. If a makeshift combustible shelter is located in a
frame structure, the consequences of ignition of the structure,
although unpleasant to contemplate, are equally obvious. However,
many situations may be expected in which the shelter itself will
survive the effects of the fire, while the shelter occupants will not
survive unless proper precautions are taken. Even after such a fire
has subsided, the hazard due to toxic gases in smouldering or
slow-burning ruins around or over shelters within the burned area may
continue for hours. Since the appropriate precautions depend directly
upon the effects being protected against, it is important to
determine just what type of countermeasures need to be taken and
under what conditions.
PAST WORK
Human tolerances of the various effects reputed to have caused
deaths in fireproof shelters have been determined in studies of fire
fighting, submarine, and manned rocket operations. A summary of the
generally accepted levels is presented in appendix A. Not so well
established is the nature of the threat to be expected in the fire
area. Although a number of designs and types of shelters have been
tested for blast and radiological protection, the fuel-free terrain
in which these tests have taken place offered no opportunity to study
the effects of mass fires over and around the shelters.
Just as the evidence obtained in wartime fires has proved to be
too conflicting for unequivocal interpretation, so have data from
past experimental fires led to conflicting interpretations. Thus,
evidence for carbon monoxide poisoning as a possible explanation
comes from a series of "burn-out" tests conducted in an
experimental dwelling-room (4). In these tests the production of
toxic concentrations varied considerably depending on the supply of
air to the fire and its path through the room. A maximum
concentration of 13.8 percent carbon monoxide was reached between the
sixth and eleventh minutes in one of the fires. On the other hand,
attempts to measure carbon monoxide concentrations sufficiently high
to produce death have not been successful on large-scale outdoor
fires (26).
OBJECTIVE
Under the terms of the Memorandum of Understanding between the
Office of Civil and Defense Mobilization and the Pacific Southwest
Forest and Range Experiment Station (Contract No. DCM-SR-59-7); dated
September 1, 1958, the objectives of this study were to:
1. Determine if critical concentrations of carbon
monoxide or toxic gases are present in an area surrounded by fire and
in a shelter within such an area.
2. Learn if there is an oxygen deficiency in an area
surrounded by fire and in a shelter within such an area.
3. Determine temperatures to be expected within a shelter
in a fire area, especially the transmission of heat through
ventilation systems or other openings.
4. Determine size of a cleared area necessary to protect
personnel (in shelters) when the area is completely surrounded by
fire.
SCOPE
The scope of the study was dictated by limited manpower and a very
limited budget. Funds allocated for the project did not permit
construction of full-scale shelters or large scale fires exclusively
for project use. Practically all field testing was accomplished with
simulated shelter vents on fires planned for other purposes.
The fires included a series of tests in structures being
demolished by fire in several California cities--tests which were
undertaken primarily to check out and calibrate instrumentation
improvised from a variety of surplus military parts, but which served
also to provide much interesting data. Five such fires were
instrumented: two in one classroom of the Robert Louis Stevenson
Junior High School, being demolished in Los Angeles [*], two in
buildings which had been turned over to the Richmond Fire Department
for destruction in connection with a redevelopment project, and one
in an El Cerrito municipal building which was being razed.
[* – This school was offered by the Los Angeles
Board of Education to the Los Angeles Fire Department for the purpose
of conducting fire tests to answer questions raised as a result of
the tragic fire at the Our Lady of the Angels School, Chicago,
Illinois on December 1, 1958, in which 95 pupils and teachers died.
The official report of those tests, entitled "Operation School
Burning," has been published by the National Fire Protection
Association, Boston, Mass. (1959).]
Then the East Bay Municipal Utility District made a large-scale
burn possible by requesting aid from the Experiment Station in
clearing about 100 acres of wooded land for a reservoir site near
Orinda, California. To clear the site, trees and brush were bulldozed
into windrows for subsequent drying and burning. The fire
instrumented for these studies consisted of 11 windrows covering a
total of about 9 acres.
Finally, a time extension of the original contract permitted one
additional proof test of previous assumptions and conclusions in a
large area burn involving a full-scale shelter at Camp Parks,
Pleasanton, California. At this site the U. S. Naval Radiological
Defense Laboratory had constructed a 100-man underground shelter. For
the burn, about 300 tons of fuel were stacked in a 4-acre plot around
this shelter, in an arrangement simulating fuel distribution in a
densely populated area of single-story dwellings.
INSTRUMENTATION
METHODS OF DRAWING SAMPLES
Most of the measurements made during the course of this project
can be lumped into two categories: temperature measurements and gas
concentration measurements. Vacuum pumps (i.e. vacuum cleaners) were
used to draw air first through vents instrumented for temperature
measurements, then through a cooling bath to cool the gases before
their entry into appropriate gas concentration measuring devices.
On the basis of discussions with Office of Civil and Defense
Mobilization engineering personnel, simulated intake vents were made
of 4-inch steel pipe 3 feet long, designed to extend 2 feet above
grade, and equipped with a protective cap on the inlet end (fig. 1).
For the preliminary calibration tests at the Stevenson Junior High
School, the cap was removed and replaced by a 10-foot section of
4-inch inside-diameter galvanized sheet steel pipe (fig. 3).
Individual tubes were run through the pipe to measurement locations
at heights of 2, 6, and 10 feet above the floor. For all of the other
experiments, air was drawn directly into the vent itself.
In addition to these stationary vents, a portable vent, or probe
(fig. 4), was used in several experiments to check temperatures and
gas concentrations which could be expected if a vent were buried
under the rubble smoldering after the flames had died down.
TEMPERATURE MEASUREMENTS
Mass fire temperatures.--Although many
conflagrations have occurred, the literature reports few actual
temperature measurements (1). Measurements made by the National
Bureau of Standards on fire tests of 2- and 5-story brick-joisted
buildings showed that temperatures as high as 2000°F. were
reached in 20 minutes, and 2200° to 2400°F. in 40 minutes.
Debris covered by fallen brick walls remained at about 1000°F for
2 or 3 days (16, p. 522). Besson (1) states that the temperatures
reached in mass fires probably will not exceed 1535° C.
(2795°F.).
For fire exposure tests of building materials, the National Fire
Codes (17, pp. 252-253), recommend a standard temperature-time
curve--reaching 1300°F. after 10 minutes and then climbing slowly
to a temperature of 1700°F. after one hour. Heat transfer
calculations given in appendix B show that such a fire over 3 feet of
soil would result in a negligible increase in the temperature of a
buried shelter. Although the properties of both soil and concrete
vary greatly, in general concrete and wood are at least as good
insulators as soil, so heat transfer through underground walls may be
ignored as a mechanism for producing casualties to personnel in
underground fall-out shelters of accepted design. The conduction of
heat into the shelter through the walls of the shelter vents is also
considered in appendix B. These computations indicate that heat
transfer down the vent walls is small in comparison with the heat
generated by shelter occupants. Thus, the intake of hot gases through
the shelter vents remains the only possible heat transfer mechanism
of serious consequence.
Selection of instrumentation.-- To confirm the
computations given in appendix B, temperatures of both the vent wall
and the inflowing gases were measured. To measure pipe wall
temperatures, chromel-alumel thermocouples were chosen because of
their ability to record temperatures up to 2500°F. To keep the
instrumentation simple, it was decided to mount identical
thermocouples in the gas stream flowing through the vents and later
to correct the thermocouple readings to true gas temperatures. The
corrections can be made by considering the vent-thermocouple system
as a large, shielded, aspirated thermocouple.
With the 12-foot stack, temperatures were measured at each of the
intake vents. With the 3-foot simulated air intake vents,
measurements were made just beneath the cap and at distances of 1, 2,
and 3 feet below the cap. At each location, thermocouples were
installed in the gas stream and in the pipe wall and led off inside
protective piping (fig. 2) to an underground cold junction. Several
vents had thermocouples installed at more than one point at the same
height to investigate radial asymmetry of the temperature
distribution. For example, figure 5 shows schematically the
thermocouple locations in the three simulated intake vents used
during the Briones Burn.
Gas temperature calculations.--Because of heat
transfer among the gas stream, the thermocouple, and the shielding
pipe, an aspirating thermocouple does not measure exactly the
temperature of the inflowing gas. The thermocouple temperature is
influenced by the temperature of the pipe walls, the gas flow rate
past the couple, the absorption spectrum of the inflowing gas, and
the emissivity of the thermocouple. With the system selected,
differences between the thermocouple reading and true gas temperature
could run as high as 500°F. for gas temperatures around 2000°F.
The true gas temperature was estimated by correcting the
thermocouple reading according to the procedure suggested by
Fishenden and Saunders (10). Assuming a perfectly transparent gas and
negligible heat conduction away from the thermocouple junction, a
steady state [*] is achieved at the thermocouple junction whenever
Qc = Qr (1)
where Qc is the convective heat transfer between the gas
and the thermocouple and Qr is the radiant heat transfer
between the thermocouple and the pipe wall.
[* – Under conditions of operation, the time
constant of the thermocouple system was appreciably less than 1
minute.]
Substituting the expression for the convective and radiant heat
transfer into equation 1 gives …
|
There were a large amount of scientific equations on Page 6 of
the report. I skipped them due to lack of time / not enough
interest – look at the ORIGINAL PDF to view them.
|
Curves of N for various values of t_m and the product Vd (where V
is the gas velocity) are given by Fishenden and Saunders for the case
of a wire (thermocouple) situated at right angles to the gas stream.
In the present study, the gas velocity of the system was measured
with an oil manometer connected into the stream. Since d is known,
and t_c and t_w are both measured, the correction term may be
computed directly from equation (7) if the emissivity is known. On
the basis of values given by Fishenden and Saunders, a value of 0.5
was assumed for the emissivity of a chromel-alumel couple. This value
may well be in error by as much as 20 percent. Thus, the temperature
corrections may also be in error by 20 percent, introducing an error
in the true gas temperature ranging up to about 5 percent at a gas
temperature of 2000°F.
GAS CONCENTRATION MEASUREMENTS
Continuous recording instrumentation.--Because most
fires were to be limited to wood fuels, it was decided to limit gas
concentration measurements to oxygen, carbon dioxide, and carbon
monoxide. Most of the commercial equipment which would measure a
continuous sampling of one or more of the three gases was quite
elaborate and rather expensive. Therefore inexpensive instruments
were purchased and modified where necessary for connection to
recording equipment.
Continuous oxygen measurement was made with a modified Thermco
Instrument Corporation Model P-9 Oxygen Analyzer which utilizes the
paramagnetic properties of oxygen for the analyses (fig. 6). A
Thermco Model P-11, Carbon Dioxide Analyzer, which operates by
measuring the thermal conductivity of the inflowing gas, was used in
the first calibration test. However, this instrument gives erroneous
results in the presence of the fairly large quantities of carbon
monoxide found, so its use was discontinued.
Continuous carbon monoxide measurements were made with instruments
developed from surplus detectors which had previously been used as
warning devices in aircraft. These detectors split the flow of a gas
sample through two cells connected by a thermopile. One cell contains
activated hopcalite which catalyzes the oxidation of carbon monoxide.
The resulting temperature difference between the two cells is a
function of the carbon monoxide concentration in the air being
sampled.
Each unit was calibrated against a series of carbon monoxide
samples whose concentrations had been accurately determined by Dr.
Milton Feldstein, Laboratory Director, San Francisco Bay Area Air
Pollution Control District. A separate calibration curve was obtained
for each unit, although the sensitivity of all units was roughly 100
millivolts for a carbon monoxide concentration of one percent (by
volume).
A single carbon monoxide detector unit is shown in figure 7, while
figure 8 illustrates the triple unit constructed to permit
simultaneous sampling from three vents.
In the Los Angeles tests, gas was drawn into a separate intake
located at the 2-foot level of the 12-foot stack and was conducted
through a cooling bath to an instrument center located outside the
building. In all subsequent burns, gases were drawn directly into the
simulated shelter intake vent, through a buried cooling bath, and to
a protected control center where the detectors were located.
During the second Los Angeles test, high concentrations of carbon
monoxide caused the detector to burn out. Consequently the apparatus
was modified to permit closure of the detector whenever carbon
monoxide concentrations rose to destructive levels. A later
calibration test indicated that the carbon monoxide detector can
tolerate concentrations of the gas up to 2 to 3 percent before the
soldered connections melt because of excessive heat generated in the
cell.
Bottle gas samples.-- During the Los Angeles tests a
few gas samples were collected in bottles for subsequent analysis,
but the method of taking the samples was poor, and the results of
these samples were questionable. To insure that good gas samples
would be taken on subsequent tests, an automatic sampling device was
constructed (fig. 9). The unit can handle six gas sampling bottles in
sequence. Upon signal, the valves of one bottle open, a vacuum pump
draws the gas sample into the bottle, the valves are automatically
closed, and the unit positions itself to take the next sample.
The bottled samples were submitted to the Bay Area Air Pollution
Control District and analyzed by Dr. Feldstein using a Beckman IR-4
Infrared Spectrophotometer with a 10-meter-path-length gas cell. All
samples were analyzed for carbon monoxide and carbon dioxide and, in
addition, select samples were analyzed for any other major
constituents.
TEST FIRES
LOS ANGELES TESTS
The two calibration tests in Los Angeles were conducted on May 23
and 25, 1959, in Room 108 of the Robert Louis Stevenson Junior High
School, 725 S. Indiana Street (fig. 10). Fuel for the first fire
consisted of 2 x 4 mill ends scattered to a depth of about 2 feet
throughout the room (fig. 11) and ignited in one corner. The fire was
permitted to burn until, in the opinion of the Los Angeles Fire
Department, it was endangering the floor above. It was extinguished
after 17 minutes--long before the fuel at the base of the vent
(located in the center of the room) could be burned.
For the second test, the room was loaded with lath and pallets in
order to obtain a hotter fire (fig. 12). The fuel was ignited at a
number of points around the outer edges of the room and allowed to
burn for less than 12 minutes before extinguishment was necessary to
prevent cave-in of the floor above (fig. 13).
RICHMOND TESTS
The first calibration test in Richmond was conducted on August 5,
1959 on a two-story four-apartment building, measuring 50 x 28 feet,
with stucco covered exterior, sheetrock covered interior, oak floors,
and scrap lumber to simulate furnishings (fig. 14). The intake vent
was located in the center of a 16 x 11-foot living room on the first
floor of the fourplex. The building was ignited and permitted to burn
to the ground (figs. 15, 16, 17, 18).
The fuel for the second Richmond test conducted on September 29,
1959, consisted of two single-story wood houses, one measuring 50 x
22 feet and the other 24 x 18 feet, about 7 feet apart at their
nearest corners (fig. 19). Two vents were used in this fire: one
located in the living room of the larger house, the other placed
between the two buildings at their point of nearest approach. During
this fire the Richmond Fire Department found it necessary to spray
considerable quantities of water in order to protect adjacent
dwellings. This spraying not only modified the progress and
characteristics of the fire but had some detrimental effects upon the
instrumentation used and the results obtained.
BRIONES BURN
During the reservoir clearing operation in Briones Canyon, trees
and brush on the slopes around the damsite were knocked down by
tractors and pushed into windrows for subsequent drying and burning.
The study area contained 11 windrows on a total of about 9 acres
(figs. 20, 21 and 22). Clearing was started in April 1959, and fuel
moisture samples of both heavy and light fuels were taken at
intervals throughout the summer to check on completeness of drying.
By mid-September fuel moisture of the small twigs had dropped to
12 percent, that of 8-inch logs to 40 percent and that of 18-inch
logs to 50 to 70 percent. On September 16, 1959, an isolated pile 150
x 25 feet, ranging in height from 4 to 12 feet was ignited to check
completeness of burning. The lighter fuels burned out completely in
less than an hour, leaving the smoldering remains of the heavier logs
which, on being bulldozed into a concentrated pile, were slowly
consumed to leave a minimum residue.
The main burn was ignited on November 2, 1959. The average
moisture content of the heavy fuels at the time of the fire was about
40 percent; for the leaves and small twigs, about 10 percent. Total
fuel on the 9-acre site was estimated at 900 tons oven-dry weight.
For this burn, three simulated shelter air intakes were
instrumented and installed between the fourth and fifth windrows at
the fire site (fig. 23). One vent, vent A, was placed 3 feet inside
the upper edge of the fifth windrow; another, vent B, 5 feet outside
the upper edge of the fifth windrow; and a third, vent C, midway
between the fourth and fifth windrows (about 25 feet from each). The
gases drawn into these vents were conducted to a buried instrument
box located near the vents. This box contained the gas sampling
mechanism and gas detectors for the vents. The instruments in the box
were remotely controlled during the fire from a bunker located
outside the immediate fire area. This control bunker contained
recorders for obtaining temperature, oxygen, and carbon monoxide
records.
The piles were ignited in sequence starting with the top windrow
at 1:00 p.m. Temperature was 60°F. and relative humidity
was 60 percent. The placement of the intake vents was designed to
take advantage of uphill drafts anticipated as a result of the fire.
Instead, westerly winds, with speeds ranging from 10 to 14 miles per
hour and gusts up to 20 miles per hour, blew the flames down-slope
(fig. 24).
EL CERRITO RUBBLE PROBE TEST
An opportunity to investigate the lingering effects of fire in
rubble presented itself when it was learned that the El Cerrito,
California, Fire Department planned to use the razing of an old
municipal building as a fire training exercise. The building (fig.
25) had been the old firehouse, jail, and police station. The jail
section had thick concrete walls and the remainder of the building
had stucco- and brick-covered walls. The building was ignited at 9:20
a.m. on March 8, 1960, and permitted to burn freely. (The nearby
buildings and telephone and power lines were protected by a water
curtain during the peak of the fire.) The second floor walls
collapsed about 1 hour after start of the fire, and the brick-covered
first floor walls began to collapse shortly thereafter.
After all unstable wall remnants had collapsed and the general
area cooled down sufficiently, probing of the rubble piles was begun.
Measurements were made of temperatures, carbon monoxide
concentrations, and oxygen concentrations at various locations within
the rubble (fig. 26) at intervals starting about 4 hours after
ignition and ending about 22 hours after ignition (7:00 a.m. on the
9th), when earth-moving equipment was brought in to complete the
demolition.
CAMP PARKS BURN
To permit experimental verification of the conclusions of a
shelter design study, the U. S. Naval Radiological Defense Laboratory
(NRDL) constructed a 100-man prototype underground shelter at Camp
Parks, Pleasanton, California (21). Since the shelter design included
a "fire storm" protection capability, a cooperative program
was undertaken.
The very limited budgets of the two participating groups precluded
the installation of extensive instrumentation. However, the
availability of a considerable quantity of scrap lumber, some
manpower to relocate the fuel and assist in the installation of
instrumentation, and a competent fire department to provide necessary
protection permitted the conduct of a minimum experiment. Additional
support was offered by the Defense Atomic Support Agency (DASA),
which authorized the release of certain instrumentation available at
NRDL, and by the U. S. Army Electronic Proving Ground, Fort Huachuca,
Arizona, which made available a 3-man team to assist in the
meteorological measurements for a 4-day period at the time of the
burn.
The original fire plans called for the burning of about 500 tons
of assorted scrap lumber and poles distributed over a 4-acre area
around the shelter. For a variety of reasons, the final fuel loading
was only about half that planned--the biggest deficit occurring in
the heavy, long burning fuels (poles and railroad ties). The wood was
distributed to simulate fuel distribution in a densely populated area
(about 30 percent density) of single-story dwellings. The fuel was
placed in piles measuring 20 x 15 feet, 7 feet high, and spaced 12
feet apart along 3 concentric rectangles with 50-foot spacing between
rectangles (figs. 27, 28). The three piles nearest the shelter
entrance were increased to a height of 9 feet by including randomly
throughout each pile an additional 2 feet of non-combustible
rubble--pieces of concrete, brick, and gypsum board.
Limited instrumentation was installed in the entranceway (fig. 29)
and main room of the shelter. However, the principal measurements
were made from three simulated air intake vents located near the
shelter entrance--vent A in a rubble-free wood pile, vent C in a pile
containing rubble, and vent B midway between the other two (fig. 30).
As with the Briones Burn, gases were led to a buried instrument box
and controls to a shielded control bunker outside the fire area.
The piles were ignited by a series of six ignition circuits--two
in each of the concentric rectangles. In order to insure nearly
simultaneous burning of all three "rings" even if both
ignition circuits in any one ring failed, about 2000 gallons of used
crankcase oil were sprayed on the fuel piles. Experienced forest fire
fighting personnel stood by with lighted drip torches to assist in
the ignition if needed.
The innermost ignition circuit was closed at 6:41 a.m. on April
15, 1960. The successive circuits were closed at 30-second intervals,
and all functioned perfectly. The weather at the time of the fire,
together with the radiation and pressure measurements made during the
fire, are presented in appendix C.
The fire grew rapidly after ignition of the outermost "ring."
By 6:45 strong indrafts from all sides were blowing the flames toward
the center of the fire, with flames 50 feet high visible through the
dense black smoke. By 6:47 the smoke began to clear, and within
another minute or two there was a noticeable reduction in fire
intensity. By 6:51, 10 minutes after the first ignition, the merging
flames had separated into a group of individually burning fires.
Within another 10 minutes some of the piles had been reduced to a bed
of glowing coals and stopped flaming. An hour after the start, one
could enter the fire area if he avoided still-burning or smoldering
fuels. The progress of the fire is depicted in figures 31-37.
RESULTS
LOS ANGELES TESTS
Data from the successful measurements of gas concentration and
temperature for the two tests in the Stevenson Junior High classroom
are presented in figure 38. As stated previously, the Thermco Carbon
Dioxide Analyzer gave erroneous results because of the high carbon
monoxide concentrations, and the bottled gas samples gave
questionable results because of the poor sampling method and long
storage before analysis.
For each test, the upper part of figure 38 presents the
measurements obtained from the oxygen and carbon monoxide analyzers,
corrected for the time constants of the instruments (about 1 minute).
In the lower part of figure 38, two sets of temperature curves are
presented for each of the three elevations--one representing the gas
temperature as measured by a thermocouple shielded from a direct view
of the flames by the ceramic elbow (thermocouples 1 and 2, fig. 3),
the other representing the erroneous value obtained by a thermocouple
(TC-3, fig. 3), which is heated by direct radiation from the flame.
It may be seen from figure 38 that the slower burning fire
obtained in test no. 1 gave conditions much less severe than those in
test no. 2. During the first test, the oxygen concentration never
fell to a dangerous level and the carbon monoxide concentration
reached only 0.35 percent (a dangerous level but much below that
found in test no. 2). Since the fire was extinguished before the fuel
at the base of the vent could be burned, temperatures were much
higher at the ceiling than they were at the lower air intakes.
During the second test, the carbon monoxide concentration reached
lethal levels within 5 minutes, and reached levels sufficiently high
to burn out the carbon monoxide detector within 9 minutes (it is
estimated that concentrations exceeded 3 percent). By the time the
fire was extinguished, the oxygen concentration had dropped to
critical levels for human survival. Again in this test the
temperatures reached their highest levels at the 10-foot intake. On
the basis of the National Fire Codes standard temperature-time curve,
the recorders were set for a full scale reading of 1800°F. This
temperature was exceeded within 8 minutes of start of ignition. [*]
[* – In a series of comparable experiments
conducted in Canada (18), G. W. Shorter et al., too, found room
temperatures could rapidly exceed those given by the standard
time-temperature curve.]
RICHMOND TESTS
The recorded data obtained during Richmond test no. 1 are
presented in figure 39 (temperatures) and figure 40 (carbon monoxide
concentration). The most important temperature observations are the
following: (1) the hottest measured temperatures occurred after the
second story collapsed around the vent (at about 40 minutes), (2) gas
temperatures exceeding 2500°F. were found for short periods, and
(3) under some circumstances, relatively cool air entering the vent
was heated to high temperatures as a result of heating of the vent
walls by radiation from the fire. (Heat transfer from the vent walls
to the air stream is by convection to the air and by radiation to the
entrained smoke particles.)
Lethal concentration of carbon monoxide were reached as the
building began to collapse, the highest concentrations occurring as
the roaring fire began to die down and the building was reduced to a
pile of rubble. To protect the instrumentation, the carbon monoxide
instruments were switched out of the gas stream when the
concentrations exceeded 1.2 percent. The oxygen analyzer was found to
be extremely sensitive to fluctuations in line voltage from the power
generator, and the resulting oxygen record was uninterpretable.
Results of the spectral analysis of the six gas bottle samples
taken during this test are presented in table 1. Of these samples,
the first five were taken from the simulated shelter vent, the sixth
was taken during probing of the residual rubble. Probing observations
were undertaken from 3 to 5 hours after start of the fire. Rubble
temperatures were so high (in the presence of a reducing (carbon
monoxide) atmosphere) that the probe thermocouples failed almost
immediately. Carbon monoxide measurements indicated carbon monoxide
concentrations as high as 0.2 to 0.4 percent during this period.
|
Table 1.--Analysis of bottled gas samples
taken during Richmond test no. 1
|
|
Sample number
|
Time after start Minutes
|
Carbon monoxide Percent
|
Carbon dioxide Percent
|
Methane Percent
|
|
1
|
13
|
0.048
|
0.1
|
10-4
|
|
2
|
19
|
0.042
|
0.1
|
10-4
|
|
3
|
34
|
1.16
|
4.0
|
0.07
|
|
4
|
44
|
3.2
|
8.0
|
0.15
|
|
5
|
113
|
0.03
|
0.1
|
<10-4
|
|
6
|
197
|
0.03
|
0.1
|
<10-4
|
The recorded data obtained during Richmond test no. 2 are
presented in figure 41 (temperatures) and figure 42 (oxygen and
carbon monoxide concentrations). Unfortunately, the temperature
recording circuit for the vent between the houses failed shortly
after the start of the fire and remained inoperable for about 50
minutes. By the time this circuit was reestablished all of the
thermocouples in the vent inside the large house had failed. The
outside vent circuit failed again at 64 minutes and remained out for
a 70-minute period except for a 15-minute interval at some unknown
time within that period. A linear interpolation between the beginning
and end portions of the curves indicate that the circuit began to
function approximately 111 minutes after the fire started, and the
appropriate curves in figure 41 have been drawn accordingly.
The oxygen analyzers functioned properly throughout the entire
test. As may be seen from figure 42, the oxygen concentration in the
outside vent never reached dangerous levels, but that in the inside
vent dropped to extremely low values about 20 minutes after the start
of the fire. At about the same time, the inside carbon monoxide
detector failed--apparently due to clogging by plaster dust.
Subsequent carbon monoxide measurements were obtained by switching
the outside detector alternately between the two vents. No
satisfactory bottled gas samples were obtained during this test
because the vacuum pump failed.
BRIONES BURN
The temperature data for the Briones Burn are given in figure 43
(vent A), figure 44 (vent B), and figure 45 (vent C).
As might be expected, the highest temperatures were obtained at
vent A, much cooler temperatures at vent B, and coolest temperatures
at vent C. However, the wall temperatures at 1 foot below ground
level were approximately the same for all three vents.
The results of the continuous gas concentration measurements are
given in figure 46. The curves have been corrected for the slow
response time of the instruments. At vent A, the carbon monoxide
reading rapidly went off scale, and the detector burned out before
precautionary measures could be taken. The oxygen concentration
dropped to practically zero (<2 percent) at about 8 minutes. At
vent B, carbon monoxide concentrations gave off-scale readings within
5 minutes of ignition time although oxygen (and temperature)
conditions were much less severe. The gas concentrations at vent C
never reached toxic levels, but carbon monoxide concentrations
sufficient to cause mild headaches lingered for several hours.
Results of the spectral analyses of the gas bottle samples taken
during this burn are presented in table 2. Unfortunately no samples
were taken during the first 10 minutes, when gas concentrations were
most severe. However, the samples do show that even in a
fast-burning, rubble-free fire such as this, serious carbon dioxide
and severe carbon monoxide effects can be found as late as an hour
and a half after ignition.
Table 2.--Analysis of bottled gas samples
taken during the Briones burn
|
|
Time after start, minutes
|
Vent
|
Carbon monoxide (%)
|
Carbon dioxide (%)
|
Methane (%)
|
|
12
|
C
|
0.02
|
0.40
|
--
|
|
13
|
A
|
.08
|
5.40
|
.0004
|
|
17
|
B
|
.03
|
2.25
|
.0002
|
|
21
|
C
|
.016
|
0.80
|
--
|
|
30
|
A
|
.04
|
5.60
|
--
|
|
31
|
B
|
.06
|
0.40
|
--
|
|
33
|
C
|
--
|
.21
|
--
|
|
34
|
A
|
.04
|
5.60
|
--
|
|
46
|
A
|
.13
|
3.50
|
.0002
|
|
85
|
C
|
.02
|
0.40
|
--
|
|
87
|
A
|
.16
|
5.80
|
.0008
|
|
88
|
B
|
.02
|
0.80
|
.0001
|
|
97
|
C
|
.008
|
.40
|
--
|
|
156
|
C
|
.016
|
.40
|
--
|
|
158
|
A
|
.04
|
.35
|
.0004
|
EL CERRITO RUBBLE PROBE TEST
Although probings into the rubble of the El Cerrito test fire were
made at a large number of points, three typical locations were used
for repeated probings over long time intervals. These three locations
are circled in figure 26, and the data obtained are shown in table 3.
During several probings, gas samples were collected for subsequent
spectrometric analysis and these results are given in table 4. It may
be seen from these tables that almost 24 hours after the start of the
fire, temperatures of almost 1900°F. and carbon monoxide
concentrations greater than 1 percent could still be found within the
rubble piles.
Table 3.--Representative gas
concentrations and temperatures in the El Cerrito Rubble Probe
Test
|
|
Location 1: Probe pushed about 4 inches into
loose rubble next to brick wall at right of entrance
|
|
Time after start (hours)
|
Probing number
|
Carbon monoxide (%)
|
Oxygen (%)
|
Temperature (°F)
|
|
4.0
|
4
|
.33
|
--
|
910
|
|
4.3
|
9
|
.60
|
17.9
|
900
|
|
6.0
|
14
|
.09
|
20.3
|
580
|
|
6.7
|
17
|
.06
|
20.0
|
360
|
|
9.7
|
21
|
.02
|
20.8
|
225
|
|
13.2
|
29
|
.03
|
20.8
|
280
|
|
21.3
|
34
|
.03
|
20.7
|
80
|
|
Location 2: Probe pushed about 6 inches into
loose rubble under pocket of plasterboard
|
|
Time after start (hours)
|
Probing number
|
Carbon monoxide (%)
|
Oxygen (%)
|
Temperature (°F)
|
|
4.5
|
11
|
.42
|
16.9
|
1290
|
|
5.9
|
12
|
.06
|
19.8
|
550
|
|
6.7
|
16
|
.08
|
20.0
|
480
|
|
9.7
|
20
|
.06
|
20.8
|
270
|
|
13.2
|
28
|
.04
|
20.8
|
250
|
|
21.3
|
35
|
.02
|
20.8
|
80
|
|
Location 3: Probe pushed about 4 inches into
bed of glowing coals in rubble piled about 3' high
|
|
Time after start (hours)
|
Probing number
|
Carbon monoxide (%)
|
Oxygen (%)
|
Temperature (°F)
|
|
9.9
|
24
|
.95
|
18.3
|
890
|
|
21.6
|
37
|
.70
|
14.9
|
1890
|
Table 4.--Analysis of bottled gas samples
taken during the El Cerrito rubble probe test
|
|
Time after start (hours)
|
Sample Number
|
Carbon monoxide (Detector) (%)
|
Carbon monoxide (Bottle) (%)
|
Carbon Dioxide (%)
|
Remarks
|
|
1.7
|
1-1
|
--
|
0.40
|
0.7
|
Sample taken through window in S.E. corner of building. No
flame in room; roof burned through in adjacent garage.
|
|
4.3
|
1-2
|
.35
|
0.38
|
2.8
|
Underneath hood-like covering of plaster.
|
|
9.8
|
1-3
|
.25
|
0.25
|
3.0
|
On top of coals under a canopy of plaster-board.
|
|
21.2
|
1-4
|
1.17
|
1.2
|
8.0
|
Probe pushed in about 4" about 2 ft. up in a 3 ft. pile
of rubble.
|
|
21.6
|
1-5
|
.70
|
0.73
|
8.4
|
Probe pushed about 4" into bed of hot coals.
|
CAMP PARKS BURN
Temperature measurements.-- Results of the
temperature measurements for the Camp Parks Burn are given in figures
47 and 48 (vent A), figure 49 (vent C), figure 50 (vent B) and figure
51 (shelter entrance). The fire in the rubble-free pile built up
quite rapidly, and all of the above-grade thermocouples in vent A
burned out within the first 10 minutes. In the pile containing
rubble, temperatures in vent C rose quite rapidly, but not nearly as
high as in vent A, then levelled off at moderately high values until,
about 4 hours after ignition, the rubble pile began to collapse about
the vent entrance. At this time temperatures again rose rapidly and
remained high and irregular for about 2 more hours until the rubble
settled to its final depth--below the vent entrance (fig. 37). The
rubble remained hot for a long time after measurements were
terminated. In fact, 5 days later, when the area was being cleared,
freshly exposed fuel in the bulldozed rubble piles again burst into
flames.
Some vent wall temperature data were lost from vent C because of
failure of the recorder to print out some results on several
circuits. At the 2-foot level, the wall temperature was recorded for
the first 1-3/4 hours, but after that only two values were printed
out--at 280 minutes and at 337 minutes. At grade level the wall
circuit did not print for the first hour, but printed almost
continuously thereafter. The wall circuit 1 foot below grade
apparently opened before the start of the fire and gave no readings
whatever. Wherever wall temperatures were not recorded, it was
necessary to estimate them in order to apply corrections to the gas
temperatures. The estimation was made by a number of different
extrapolations, and since the corrections were not very sensitive to
the wall temperature used, the additional error from this source in
the gas temperature values given is not more than 10 to 20°F.
The relatively low temperatures obtained by thermocouples not
actually in one of the fuel piles may be seen in the data for vent B
and for the shelter entrance. As may be noted in figure 29, TC-12 was
suspended in front of the entrance. TC-1 through TC-4, mounted on the
inside of the uninsulated portion of the entrance, reached values of
200° to 300°F. for a short while. The exhaust vent (TC-24)
reached a peak temperature of 150°F. No other thermocouple
recorded a temperature higher than 100°F., and most of the
thermocouples in the entranceway and at other locations throughout
the shelter, failed to show any significant increase in temperature
as a result of the fire.
Gas concentration measurements.-- Gas concentration
measurements at Camp Parks included the following: (1) continuous
oxygen measurements at each of the three simulated vents; (2)
continuous carbon monoxide measurements at each of the three
simulated vents and inside the shelter entrance; and (3) gas bottle
sampling from each of the three simulated vents and in the main room
of the shelter.
Oxygen results: Oxygen concentrations for vents B and C are
shown in figure 52. As may be seen, the oxygen concentration at vent
B did not drop significantly at any time. At vent C, the oxygen
concentration began to decrease almost immediately (approximately 1
minute after ignition of the inner ring) and dropped almost to zero
(less than 2 percent). The oxygen concentration remained at a very
low level until the vent began to emerge from the rubble pile as the
pile collapsed around it some 3 to 4 hours after the start of the
fire.
The oxygen analyzer connected to vent A began to give erratic
results before the start of the fire, and the subsequent record is
completely uninterpretable.
Continuous carbon monoxide recordings: The unit connected to vent
A indicated an off-scale reading (greater than 2 percent carbon
monoxide) about 1-1/2 minutes after ignition of the inner "ring,"
and this unit burned out shortly thereafter. The highest value of
carbon monoxide observed in vent B was 0.08 percent about 6 minutes
after ignition of the first "ring." Other representative
values for this vent are given in the last column of table 5. The
carbon monoxide analyzer attached to vent C indicated no reading
until about 4 minutes after ignition of the first "ring;"
then it rapidly shot off scale. Although the unit was disconnected
from the flow system in time to prevent burning out, repeated
attempts to obtain an on-scale reading soon filled the instrument
with a large volume of liquid, wood-distillation products and no
further meaningful data could be obtained with this unit. The carbon
monoxide analyzer in the shelter entrance showed no detectable
concentration of carbon monoxide entering the shelter (less than 0.02
percent). The unit was subsequently connected to a known source of
carbon monoxide to confirm the fact that it was operating properly.
Bottled gas samples: The results of the spectrometric analysis of
the bottled gas samples are given in tables 5 and 6. As may be seen
in table 6, the carbon monoxide concentration in vent A remained high
for only a relatively few minutes-dropping rapidly as the wood pile
was consumed. On the other hand, the carbon monoxide concentration
entering vent C remained extremely high for 3 or 4 hours--dropping to
safe levels only after the rubble pile settled below the level of the
vent entrance. The carbon monoxide concentrations observed were 4 or
5 times the concentration sufficient to cause death in 2 or 3
minutes. A representative gas sample from this vent was also
subjected to gas chromatographic analysis, with the results given in
the footnote to table 6.
Analysis of the gases in the main shelter room showed the highest
carbon monoxide concentration observed to be only 0.001 percent
before opening the shelter door. After the shelter was opened and
several groups of observers had passed through, the concentration
rose to 0.02 percent.
In table 5, considerable discrepancy may be noted between the
values obtained for vent B by analysis of the gas bottle samples
(column 3) and those obtained with the carbon monoxide detector unit
(column 5). Subsequent measurements taken inside the buried
instrument box showed a very high accumulation of carbon monoxide in
this box (no attempt had been made to vent the instrument exhausts
outside the box). A linear accumulation with time would give the
interpolated values in column 4 for carbon monoxide concentration in
the box. It is almost certain that one of the hoses connected to the
gas sampler for vent B opened and that the samples were actually
drawn from inside the instrument box.
Table 5.--Carbon monoxide measurements during
the Camp Parks Burn
|
|
- - - - - Percent carbon monoxide - - - - -
|
|
Time after start (min)
|
In Shelter
|
Vent B (Bottle)
|
Interpolation for Instrument Box
|
Vent B (Detector)
|
|
6
|
--
|
--
|
--
|
.08
|
|
8
|
--
|
.03
|
.04
|
.06
|
|
12
|
< .001
|
--
|
--
|
.04
|
|
16
|
--
|
.16
|
.15
|
.07
|
|
19
|
< .001
|
--
|
--
|
.08
|
|
30
|
--
|
.44
|
.35
|
.05
|
|
34
|
.001
|
--
|
--
|
.04
|
|
69
|
--
|
.72
|
.85
|
.02
|
|
122
|
.02
|
--
|
--
|
.02
|
Table 6.--Analysis of bottled gas samples
taken during the Camp Parks Burn
|
|
Time after start, minutes
|
Vent A – Carbon monoxide (%)
|
Vent A – Carbon dioxide (%)
|
Vent C – Carbon monoxide (%)
|
Vent C – Carbon dioxide (%)
|
|
6
|
1.5
|
7.7
|
--
|
--
|
|
14
|
--
|
--
|
5.8
|
7.8
|
|
18
|
.11
|
0.7
|
5.2 [*]
|
--
|
|
27
|
--
|
--
|
|
1.5
|
|
33
|
.16
|
.06
|
--
|
--
|
|
37
|
.16
|
.04
|
--
|
--
|
|
65
|
.16
|
.3
|
--
|
--
|
|
81
|
--
|
--
|
5.0
|
6.2
|
|
90
|
--
|
--
|
7.0
|
7.7
|
|
170
|
--
|
--
|
6.5
|
8.0
|
|
326
|
--
|
--
|
.04
|
1.5
|
|
* – Other gases identified (by gas chromatography)
Ethane ---1280 ppm
Ethylene---2280
ppm
Acetylene--- 456 ppm
Propane--- 254 ppm
Propylene---
920 ppm
C4 compounds--- 528 ppm
C5 compounds--- present but
not identified
C6 compounds--- present but not identified
|
CONCLUSIONS
Within the limitations of this project's rather restricted scope,
the results recorded contribute significantly towards the attainment
of its listed objectives. The conclusions reached, however, should be
tempered by the limitations imposed. Thus, although the experiments
conducted during the course of this study were designed to shed some
light on what might be expected under conditions of mass fire, it is
important to remember that the largest burn conducted in this series
was much smaller than the minimum necessary to fall within the
definition of a mass fire. The two large burns described in this
report covered areas of 9 and 4 acres, respectively, while mass fires
require the involvement of at least 640 acres (1 square mile) (23).
Also, since a large-scale fire is a highly variable and complex
phenomenon, it is difficult to decide how "typical" these
fires might be, that is, how often events observed during these fires
would be found in other "similar" fires. As a matter of
fact, it is necessary to use considerable caution in extrapolating
the measurements made during these fires to other locations within
the same fires.
However, the same inability to predict with certainty the
conditions that will prevail at any time at any point in a future
fire necessitates the establishment of "worst-case"
conditions, and the development of precautions and countermeasures
for such conditions. If a dangerous situation was encountered even
once during these experiments, it is safe to assume that it will be
encountered again in some future fire and that a feasible attempt to
mitigate the consequences should be encouraged.
With the above precautions in mind, the major conclusions which
appear from examination of the data obtained during this project may
be listed as follows:
1. Extreme carbon monoxide concentrations are to be expected in
large-scale fires burning out of doors.
2. Although oxygen depletion and high carbon dioxide
concentrations may also occur, their effects will be of consequence
only if some steps are taken to eliminate the carbon monoxide hazard.
3. Air temperatures in the fire may be expected to exceed 2000°F,
and conventional ventilation systems, if operated during the fire,
may be expected to carry into the shelter much more heat than is
generated by the shelter occupants.
4. If ventilation systems are to be operated during a fire,
shielding of the intake vents from radiant heat should be considered
since, under certain circumstances, cool intake gases may actually be
heated in passing through the vents.
5. Smoldering rubble will maintain higher temperatures and toxic
gas concentrations for longer periods than the more impressive
flaming phase of a large fire. In fact, it appears that if shelter
vents are located so that they will not be covered by rubble, closure
for more than an hour or two will seldom, if ever, be necessary.
Conversely, if the vents are covered by rubble, closure for a period
of days may be required.
6. Placing a home shelter vent just outside of a residence may be
of little value since high concentrations of toxic gases will
sometimes be found in these locations.
7. Although fatal concentrations of carbon monoxide were found 5
feet from the fire--and concentrations sufficiently high to cause
headaches were found 25 feet from the nearest fuel--during the
Briones Burn, no significant concentrations were found outside of the
burning piles during the Camp Parks Burn. What would occur in a much
larger fire is impossible to predict, but a good rule to follow would
seem to be: where possible, locate a shelter in a cleared area
sufficiently large that the shelter will not be covered with rubble,
and within that area locate the vent as far as possible from
combustible materials.
APPENDIX A – HUMAN TOLERANCE OF VARIOUS FIRE EFFECTS
If the area above an underground shelter is subjected to the fire
effects of a nuclear detonation, the intake air entering the shelter
vents may be hazardous to the shelter occupants. The major hazards to
the shelter occupants include:
(1) oxygen depletion
(2) carbon dioxide
(3) carbon monoxide
(4) heat
While a hazard may exist from certain other toxic gases, e.g.
hydrogen sulfide, nitrogen oxides, hydrocyanic acid, and certain
hydrocarbon vapors, (8) these gases are found only in special cases
and do not have the universal applicability of the hazards listed
above.
Factors such as the concentration of the gases and the duration of
exposure have a general influence in establishing the consequences of
exposure of shelter occupants to these hazards. However, these
consequences are also affected by such factors as the individual
susceptibility and the degree of physical activity. It is obvious,
therefore, that the various sources of data, obtained under different
circumstances and for different types of individuals, present
conflicting information. Nevertheless, the following sections provide
a reasonable indication of the possible consequences of exposure of
shelter occupants to the four major hazards.
Oxygen deficiency.--Anoxia (oxygen deficiency) is
defined as a lack of sufficient oxygen for the metabolic needs of the
body tissues. It can result from a decrease in the oxygen content of
inhaled air or from interference with any phase of the uptake,
transport, and utilization of oxygen.
Table 7 summarizes information compiled by Sollman (20 p. 700) and
indicates the effects of decreased oxygen concentration in the
inhaled air.
Table 7.--Effects of oxygen
deficiency
|
|
Oxygen content of inhaled air (%)
|
Effects
|
|
20.9
|
No effects; normal air.
|
|
15
|
No immediate effect.
|
|
10
|
Dizziness; shortness of breath; deeper and more rapid
respiration; quickened pulse, especially on exertion.
|
|
7
|
Stupor sets in.
|
|
5
|
Minimal concentration compatible with life.
|
|
2-3
|
Death within one minute.
|
Carbon dioxide.-- High carbon dioxide concentrations
in the intake air are of concern for three reasons: (1) there are
direct toxic effects of carbon dioxide itself. (2) Since carbon
dioxide acts to stimulate the respiratory center of the brain, its
presence in high concentrations may cause an abnormally high intake
of other toxic gases. (3) High carbon dioxide concentrations usually
occur as a result of combustion and thus frequently are accompanied
by a lowered oxygen concentration. The effects of carbon dioxide when
no oxygen deficiency occurs in the inhaled air are listed in table 8,
which was also prepared from information compiled by Sollman (20, p.
695).
Table 8.--Effects of carbon
dioxide (oxygen content normal)
|
|
Carbon dioxide content of inhaled air (%)
|
Effects
|
|
.04
|
No effects; normal air.
|
|
2.0
|
Breathing deeper; tidal volume increased 30%.
|
|
4.0
|
Breathing much deeper; rate slightly quickened; considerable
discomfort.
|
|
4.5 - 5
|
Breathing extremely labored, almost unbearable for many
individuals. Nausea may occur.
|
|
7 - 9
|
Limit of tolerance.
|
|
10 -11
|
Inability to coordinate; unconsciousness in about 10 minutes.
|
|
15 -20
|
Symptoms increase, but probably not fatal in 1 hour.
|
|
25 -30
|
Diminished respiration; fall of blood pressure coma; loss of
reflexes; anesthesia. Gradual death after some hours.
|
Carbon monoxide.--Carbon monoxide combines with
hemoglobin in the victim's blood, thus preventing the hemoglobin from
transporting oxygen to the body tissues. The affinity of hemoglobin
for carbon monoxide is 210 times greater than that for oxygen (22).
Thus, the ultimate effect of an excess of carbon monoxide is the same
as occurs with an oxygen deficiency.
Claudy (7) presents a table (reproduced here as table 9)
describing the physical effects observed in clinical tests when a
victim has been exposed to an atmosphere containing carbon monoxide.
Presumably the effects described in this table apply to young,
healthy fire fighters, who are most quickly affected due to their
active metabolism for they absorb the gas faster than do older
persons with a lower metabolic activity (8).
Table 9.--Effects of carbon
monoxide
|
|
Carbon monoxide content of inhaled air (%)
|
Effects
|
|
0.02
|
Possible mild frontal headache after 2 to 3 hours.
|
|
0.04
|
Frontal headache and nausea after 1 to 2 hours. Occipital
(rear of head) headache after 2-1/2 to 3-1/2 hours.
|
|
0.08
|
Headache, dizziness and nausea in 3/4 hour. Collapse and
possible unconsciousness in 2 hours.
|
|
0.16
|
Headache, dizziness and nausea in 20 minutes. Collapse,
unconsciousness and possible death in 2 hours.
|
|
0.32
|
Headache and dizziness in 5 to 10 minutes, unconsciousness and
danger of death in 30 minutes.
|
|
0.64
|
Headache and dizziness in 1 to 2 minutes, unconsciousness and
danger of death in 10 to 15 minutes.
|
|
1.28
|
Immediate effect. Unconsciousness and danger of death in 1 to
3 minutes.
|
Heat.--Buettner (5) in a study of human reactions to
heat above the "comfortable range" compiled data from a
large number of tests and reports and presented them in an
illustration reproduced in figure 53. The figure presents safe
exposure times based on the assumptions that wall and air temperature
are equal, free convection occurs between the air and the skin, and
water condensation on the skin can be neglected.
One other heat effect which has been suggested as contributing to
the death of shelter occupants has been the searing of lungs due to
inhalation of hot gases. With respect to this possibility, Buettner
(6) states that air which is hot enough to cause internal burns due
to inhalation would probably have caused lethal external burns much
more rapidly. Moritz et al. (15) in studies conducted to determine
the effects of inhaled heat observed, ". . . the quantity of
heat that can be stored in the volume of gas that constitutes a
breath is remarkably small. At any given air temperature the number
of calories that can be transferred to the respiratory tract incident
to the inhalation of a breath of hot air is limited by the volume of
that breath, whereas in the case of the surface of the body where
convection currents are capable of bringing a practically unlimited
volume of hot air in contact with the skin, an infinitely greater
caloric transfer can occur for each unit of surface area exposed."
In one of their tests, (that were conducted on dogs) a source
temperature of 932°F. dropped to 122°F. within the trachea of
a dog during a period of active and deep breathing.
APPENDIX B – HEAT TRANSFER COMPUTATIONS
Heat flow into a shelter through shelter walls.--Since
a principal requirement of shelters in time of nuclear attack is
protection against the radiological hazards of fallout, all useful
shelters will have considerable mass interposed between the inside
and outside of the shelter. For example, for underground shelters, 3
feet of earth cover is required to give essentially complete
radiation protection. Such a shield should also provide a more than
sufficient barrier to heat flow into the shelter from a fire burning
overhead. However, a simple computation was made to confirm this
assumption.
For this computation, it was assumed that an underground shelter
can be considered a small cavity in a semi-infinite solid. An
alternate assumption would be that the shelter served as a complete
insulating medium under an infinite slab of thickness corresponding
to the burial depth. Actual heat conduction into a shelter would be
expected to be intermediate between that computed under these two
assumptions, but, under the assumed conditions, the two values do not
differ greatly, and it is felt that the semi-infinite solid will more
nearly represent the true conditions.
Computations were made for 4 materials: wood (white
pine--perpendicular to the grain), concrete (ranging from cinder to
3,000 psi stone concrete), soil (ranging from loose packed clay and
silt of normal moisture content, 21 percent, to wet compacted sand, 4
percent moisture content,) and steel (1 percent carbon). The
temperature on the outside of the solid, which was originally at
60°F., was assumed to rapidly reach, and be maintained at,
2000°F. For various thicknesses of the 4 materials, computations
were made of the time necessary for the temperature of the inside
surface to increase 30° to 90°F. The results of these
computations, based upon the equation on p. 39 of reference 14 and
data from references 21, 27, and 12, are presented in figure 54.
As may be seen, a fire maintaining a temperature of 2000°F.
for 2 hours or so would not produce a significant temperature change
inside a shelter which affords any reasonable fallout protection. In
fact, unless essentially the entire surface of the shelter is covered
with hot rubble for periods considerably longer than 24 hours,
transfer by conduction through the walls into a shelter covered by 3
feet of earth (or equivalent) may be ignored.
Heat flow through the ventilation system.--The
recommended minimum ventilation rate into shelters is 5 cubic
feet per minute per person (25). According to Strope, et al.
(12), the total heat output per shelter occupant is about 400 BTU per
hour. For the simulated shelter intake vents used in these
experiments the air intake rate was maintained at about 25 cubic feet
per minute corresponding to a shelter occupancy of 5 persons. The
heat output of the occupants of such a shelter, then, would be 2,000
BTU per hour, and it is of interest to see how heat flow into the
shelter through such a system would compare with this internally
generated value (Strope already has considered the problem of heat
loss to the ground in such a system).
The first question of interest concerns the heat flow down the
pipe walls assuming the ventilation system were turned off. As an
extreme case, it can be assumed that the above-grade portion of the
pipe is maintained at a temperature of 2000°F. and that heat flow
is unidimensional down the 3-foot below-grade length of the pipe to a
heat sink maintained at 70°F. Using equations and parameter
values given by Giedt (11), it may readily be computed that heat flow
into the shelter under such circumstances is 285 BTU/hr.--quite small
compared with that generated by the shelter occupants. (The same size
pipe could, of course, be used with more or fewer occupants.)
The next question concerns the heat carried into the shelter by
hot gases if the ventilation system is operating. Again using data
from Giedt, it may readily be computed that air entering at 2000°F.
would carry into the shelter a net heat of 56,000 BTU/hr.--much more
than the heat generated by the shelter occupants.
To shelter occupants, of course, it is immaterial whether the
entering air reached its maximum temperature before entering the
ventilation system or while moving through the above-grade portion of
the vent. Heat losses below grade, or to a filtering system, would
have to reduce this heat flow by a factor of 100 or more to keep this
method of shelter heating from being limiting.
APPENDIX C – ANCILLARY MEASUREMENTS AT CAMP PARKS
METEOROLOGICAL MEASUREMENTS [*]
[* – Information furnished by M. J. Schroeder,
research meteorologist, U. S. Weather Bureau, on assignment to the
Pacific Southwest Forest and Range Experiment Station.]
General weather.--During
the week of April 11, 1960 a succession of fronts moved across
northern and central California. The strongest of these passed
through central California the forenoon of April 11. It was
associated with a rather strong trough aloft and produced varying
amounts of light rain in the area. The last frontal passage before
the Camp Parks burn occurred early on April 14. It produced no rain
in the Camp Parks area. Behind the front surface, high pressure
extended into the Pacific Northwest and set up a pattern favorable
for northwesterly winds in the Camp Parks area. A slight trough aloft
was associated with this front, and, as it moved to the east, the
Camp Parks area was in a region of northwesterly winds aloft also.
Wind speeds aloft were quite strong because of the nearness of the
jet stream which extended through southwestern Oregon and
northeastern California.
Weather forecast.--Weather
forecasts for the Camp Parks area were obtained from the Weather
Bureau Forecast Center in San Francisco daily for several days before
the burn. On April 13 the outlook received indicated fair weather for
April 15. The forecast received the forenoon of April 14 again
indicated fair weather, with a morning low temperature of 40°F.
The forecast received the afternoon of April 14 was similar, and
predicted westerly winds of 8 to 15 knots. It appeared then that
there would be no stratus in the morning and that the ridge aloft
would remain off the coast so that northwesterly winds aloft could be
expected.
Weather observations.--Surface observations of wind were recorded
at Camp Parks for 10 days before the burn, and temperature and
humidity were recorded for 3 days before, in an attempt to detect
local weather patterns that would be of help in selecting a suitable
ignition time. The wind observations showed mostly light and variable
winds during the night hours with some north and north-east winds,
apparently due to drainage off the slopes of Mt. Diablo. Shortly
after sunrise, the direction would become westerly and would continue
through the day. Speeds would increase around mid-afternoon and would
remain moderately strong through the afternoon.
The temperature and humidity traces showed nothing but the normal
diurnal changes.
Pilot balloon observations were taken hourly on April 13 and 14
from 0600 to 1200 P.s.t. On April 15 runs were made hourly 0600 to
0900 P.S.T., and additional runs were made at short intervals during
the first part of the fire.
On April 13, because of the presence of a layer of stratus clouds,
the first pilot balloon observations were short runs. During the
latter portion of the forenoon, after the clouds dissipated, winds
were generally westerly to 10,000 feet and speeds were of the order
of 6 to 10 m.p.h. up to 6,000 feet and 10 to 15 m.p.h. up to 10,000
feet.
On April 14 winds were generally northwesterly up to 10,000 feet.
Speeds were of the order of 10 to 15 m.p.h. in the first 5,000 feet
then increased to 20 to 35 m.p.h. in the 5,000 to 10,000-foot layer.
Weather during the morning of April 15.--The radiosonde
observation from the Weather Bureau Airport Station at Oakland taken
at 0400 P.s.t. (fig. 55) showed that the marine layer was fairly
deep. The base of the marine inversion was at 5,000 feet. Although
the inversion was not strong, the air masses both below and above the
inversion were comparatively stable. Considerable heating would have
been required to produce an unstable layer to even 7,000 to 10,000
feet.
The surface winds, temperature, and humidity for the period 0300
to 0900 are shown in figure 56. Surface winds, which became
southwesterly shortly after sunrise, were in the process of veering
to northwesterly and increasing in speed during the first part of the
fire. The temperature had reached a minimum of nearly 40°F. just
before 0600 and was climbing rapidly at the time the fire was
ignited. The humidity, after reaching a maximum of about 100 percent
was falling rapidly at that time.
Winds aloft the morning of April 15 (fig. 57) were northwesterly
and much stronger than they had been the previous days. A significant
factor which undoubtedly affected fire behavior was the strong
increase in the wind speed from the surface through the first 600
feet. This was evident on all pilot balloon runs. Those runs that
reached higher elevations also showed a distinct minimum speed in the
region of 3,000 to 5,000 feet above sea level. Most runs indicated
another maximum in speed of 45 to 55 m.p.h. between 7,000 and 10,000
feet.
Conclusions.--With the limited meteorological
program used during this burn, it was not possible to detect any
significant effects of the fire on the local weather pattern. In fact
it appeared that the weather had almost complete control of the fire.
Although the fire produced indrafts near the surface on all sides,
any convection column that tried to form, quickly entered the region
of strong winds just above the surface and was carried off to the
southeast. These strong winds aloft, combined with the stable
structure of the lower atmosphere, effectively prevented the
formation of a vertical convection column.
RADIATION MEASUREMENTS
Radiation measurements of the Camp Parks Burn were obtained as an
aid in describing the progress of the fire. These measurements were
limited to available instrumentation, namely, one directional
thermopile radiometer and one spherical copper radiometer.
The directional radiometer, described elsewhere (19), was placed
about 40 feet above ground in the fire tower adjacent to the Camp
Parks fire station. The tower was located 890 feet north of the
center of the shelter (700 feet from the nearest side of the outer
fuel ring). The radiometer's field of view included all of the fuel
piles but two: one at each of the closest two corners of the outer
fuel ring. A continuous record was obtained of the radiant energy
received from the fire by the radiometer and is presented in figure
58.
Simple integration of the radiation values received by the
directional radiometer over a hemisphere of a radius of 890 feet
covering the fire area would result in a total considerably lower
than the actual radiant energy released by the fire. Since the
directional radiometer was set up in a location perpendicular to the
wind, the record obtained may represent the average radiation emitted
in a horizontal plane around the fire. However, locations above the
fire on such a hemisphere would see much more of the radiating area.
The spherical copper radiometer consisted of a 3-inch diameter
thin walled copper sphere, coated with lamp black, with a
chromel-alumel thermocouple located in the center of the air space
inside the ball. The ball was mounted eleven feet above the top of
the shelter berm on the top of the antenna mast connected to the
exhaust vent of the shelter. A continuous record of the temperature
of the air space inside the blackened ball was obtained during the
fire and is presented in figure 59.
A comparison of figures 58 and 59 indicates that the average time
of maximum radiant energy emitted by the fire was about 7 minutes
after the ignition of the inner ring of fuel. The temperature of the
spherical copper radiometer reached a peak value 6 minutes after
ignition of the inner ring. Since this instrument was located in such
a position that it would receive more energy from the inner ring than
from either of the other two rings, this time to peak probably
corresponds to the "peak" time of the inner ring. The
directional radiometer record peaked at 8 minutes after ignition of
the inner ring, or 6 minutes after the ignition of the outer ring.
This result may be expected since this radiometer was positioned so
as to receive more radiation from the outer ring than from either of
the other rings. The dense smoke caused by the burning of the oil
sprayed on the fuel piles also prevented this radiometer from seeing
the inner two rings until some 9 minutes after the initial ignition.
It may be concluded that the radiant energy emitted by each fuel
ring rapidly increased after ignition to a "peak" at 6
minutes after the ring was ignited and then dropped off slowly. The
average peak radiation of the fire probably occurred at 7 minutes
after initial ignition.
PRESSURE MEASUREMENTS
In attempting to answer questions concerning the fire behavior,
the pressure fluctuations within a fire area are of interest. Also,
questions have been raised concerning possible oxygen depletion in an
underground shelter caused by a severe drop in the atmospheric
pressure within a fire area.
Only one pressure measurement was made during the Camp Parks Burn.
A Friez microbarograph was placed in the main room of the shelter and
a continuous record of the atmospheric pressure was obtained. A copy
of this record, magnified 40 fold on the pressure scale, is presented
in figure 60.
Although the trace was difficult to read with any great degree of
accuracy, figure 60 does indicate that a slight but definite pressure
decrease, sharper than the routine fluctuations in the trace,
occurred about 8 minutes after ignition of the inner ring of fuel.
Comparison with the other curves obtained from this fire leads to the
conclusion that a decrease in atmospheric pressure occurred at the
time of the "peak" of the fire.
LITERATURE CITED
1. Besson, J., and Fackler, J. P.
1951. Fire-belt spaces in metropolitan areas. Tech. Ref.
Anal. Br., Engin. Res. Dev. Labs. Rpt. USA ERD CE 8-76-04-214. 28
pp., illus.2.
2. Bond, Horatio
1946. Fire and the air war. Nat'l Fire Protect. Assoc.
Boston. 262 pp., illus.3. Broido, A., and Trilling, C.
1955. Thermal vulnerability of military installations. U.S. Nav.
Rad. Defense Lab. Rpt. USNRDL-TR-101. 91 pp., illus.4. Bruce, H. D.
1953. Experimental dwelling-room fires. U. S. Forest Serv. Forest
Prod. Lab. Rpt. No. D1941. 22 pp., illus.5. Buettner, K.
1957. Heat transfer and safe exposure time for man in extreme
thermal environment. ASME Paper No. 57-SA-20. (Abstract in symposium,
Man and His Thermal Environment.) Mech. Engin. 79(11): 1029-1035.6.
Buettner, K.
1959. Personal communication.7. Claudy, W. D.
1954. Carbon monoxide in fire fighting. Nat'l. Fire Protect.
Assoc. Rpt. No. F21-1. 11 pp.8. Committee on Fire Gas Research.
1952. Fire gas research report. Nat'l. Fire Protect. Assoc. Quart.
45(3): 280-306, illus.9. Earp, Kathleen F.
1953. Deaths from fire in large scale air attack-with special
reference to the Hamburg fire storm. Home Office Rpt. CD/SA-28.
Scientific Advisory Branch, Whitehall, S.W.1. 30 pp.10. Fishenden,
M., and Saunders, O. A.
1939. The errors in gas temperature measurement and their
calculations. J. Inst. Fuel. (London). 12(6): S 5 - S 15, illus.11.
Giedt, W. H.
1957. Principles of engineering heat transfer. D. Van Nostrand Co.
Inc. New Jersey. 372 pp., illus.
12. Ingersoll, L. R., Zobel, O. J., and Ingersoll, A. C.
1948. Heat conduction. Mcgraw-Hill Book Co. New York. 278
pp., illus.
13. Leutz, Herrmann
1960. Results of tests on continuously occupied shelters.
Presented at the National Academy of Sciences-National Research
Council meeting on Environmental Engineering in Protective Shelters
(February 8-10, 1960)
14. McAdams, W. H.
1954. Heat transmission. McGraw-Hill Book Co., New York.
532 pp., illus.
15. Moritz, A. R., Henriques, F. C., and McLean R.
1945. The effects of inhaled heat on the air passages and
lungs. Amer. Jour. Path. 21: 311-356, illus.
16. Moulton, R. S.
1954. Crosby-Fiske-Forster handbook of fire protection.
11th ed. Nat'l. Fire Protect. Assoc. Boston. 1560 pp.,
illus.
17. National Fire Protection Assoc.
National Fire Codes. Boston. Vol. 3, 769 pp., illus.
18. Shorter, G. W., McGuire, J. H., Hutcheon, N. B., and Legget,
R. F.
1960. The St. Lawrence burns. Nat'l. Fire Protect. Assoc.
Quart. 53(4): 300-316, illus.
19. Snyder, N. W., Gier, J. R., and Dunkle, R. V.
1955. Total normal emissivity measurements on aircraft
materials between 100 and 800°F. Trans. Amer. Soc. Mech. Engin.
77: 1011-1019.
20. Sollman, T.
1948. Systematic action of gases. A manual of
pharmacology. 7th ed. W. B. Saunders Co. Philadelphia. pp. 693-711.
21. Strope, W. E., Porteous, L. G., and Greig, A. L.
1959. Specifications and costs of a standardized series
of fallout shelters. U.S. Nav. Rad. Def. Lab. Rpt. USNRDL-TR-366. 129
pp., illus.
22. U. S. Department of the Navy
1956. Submarine medicine practice. Bur. Med. and Surg.
NAVMED-P5054. 357 pp., illus.
23. U. S. Federal Civil Defense Administration
1953. Civil defense urban analysis. Fed. Civ. Def. Admin.
Tech. Manual TM-8-1. 85 pp., illus.
24. U. S. Office of Civil and Defense Mobilization.
1958. The national plan for civil defense and defense
mobilization. Annex 10. National shelter plan. 7 pp.
25. U. S. Office of Civil and Defense Mobilization.
1958. Family shelters for protection against radioactive
fallout. Off. Civ. Def. Mobil. Tech. Bul. TB-5-3. 8 pp., illus.
26. Vehrencamp, John E.
1955. An investigation of fire behavior in a natural
environment. Univ. of Calif. (Los Angeles) Dept. of Engin. Rpt. No.
55-50. (Oper. Firestop Tech. Rpt. No. 1) 85 pp., illus.
27. Washburn, E. W.
1927. International critical tables. V. 2. McGraw-Hill
Book Co., New York. 616 pp., illus.
– – – – – – –
– – – – – – – – –
– – – – – – – – –
– – – – – – – – –
– – – – – – – – –
– – – – – – – – –
– – – – – –
|
The section below contains a large amount of graphs/images;
which I have skipped due to not enough time to do them all. If you
wish to view them, CLICK HERE to view the original PDF file.
|
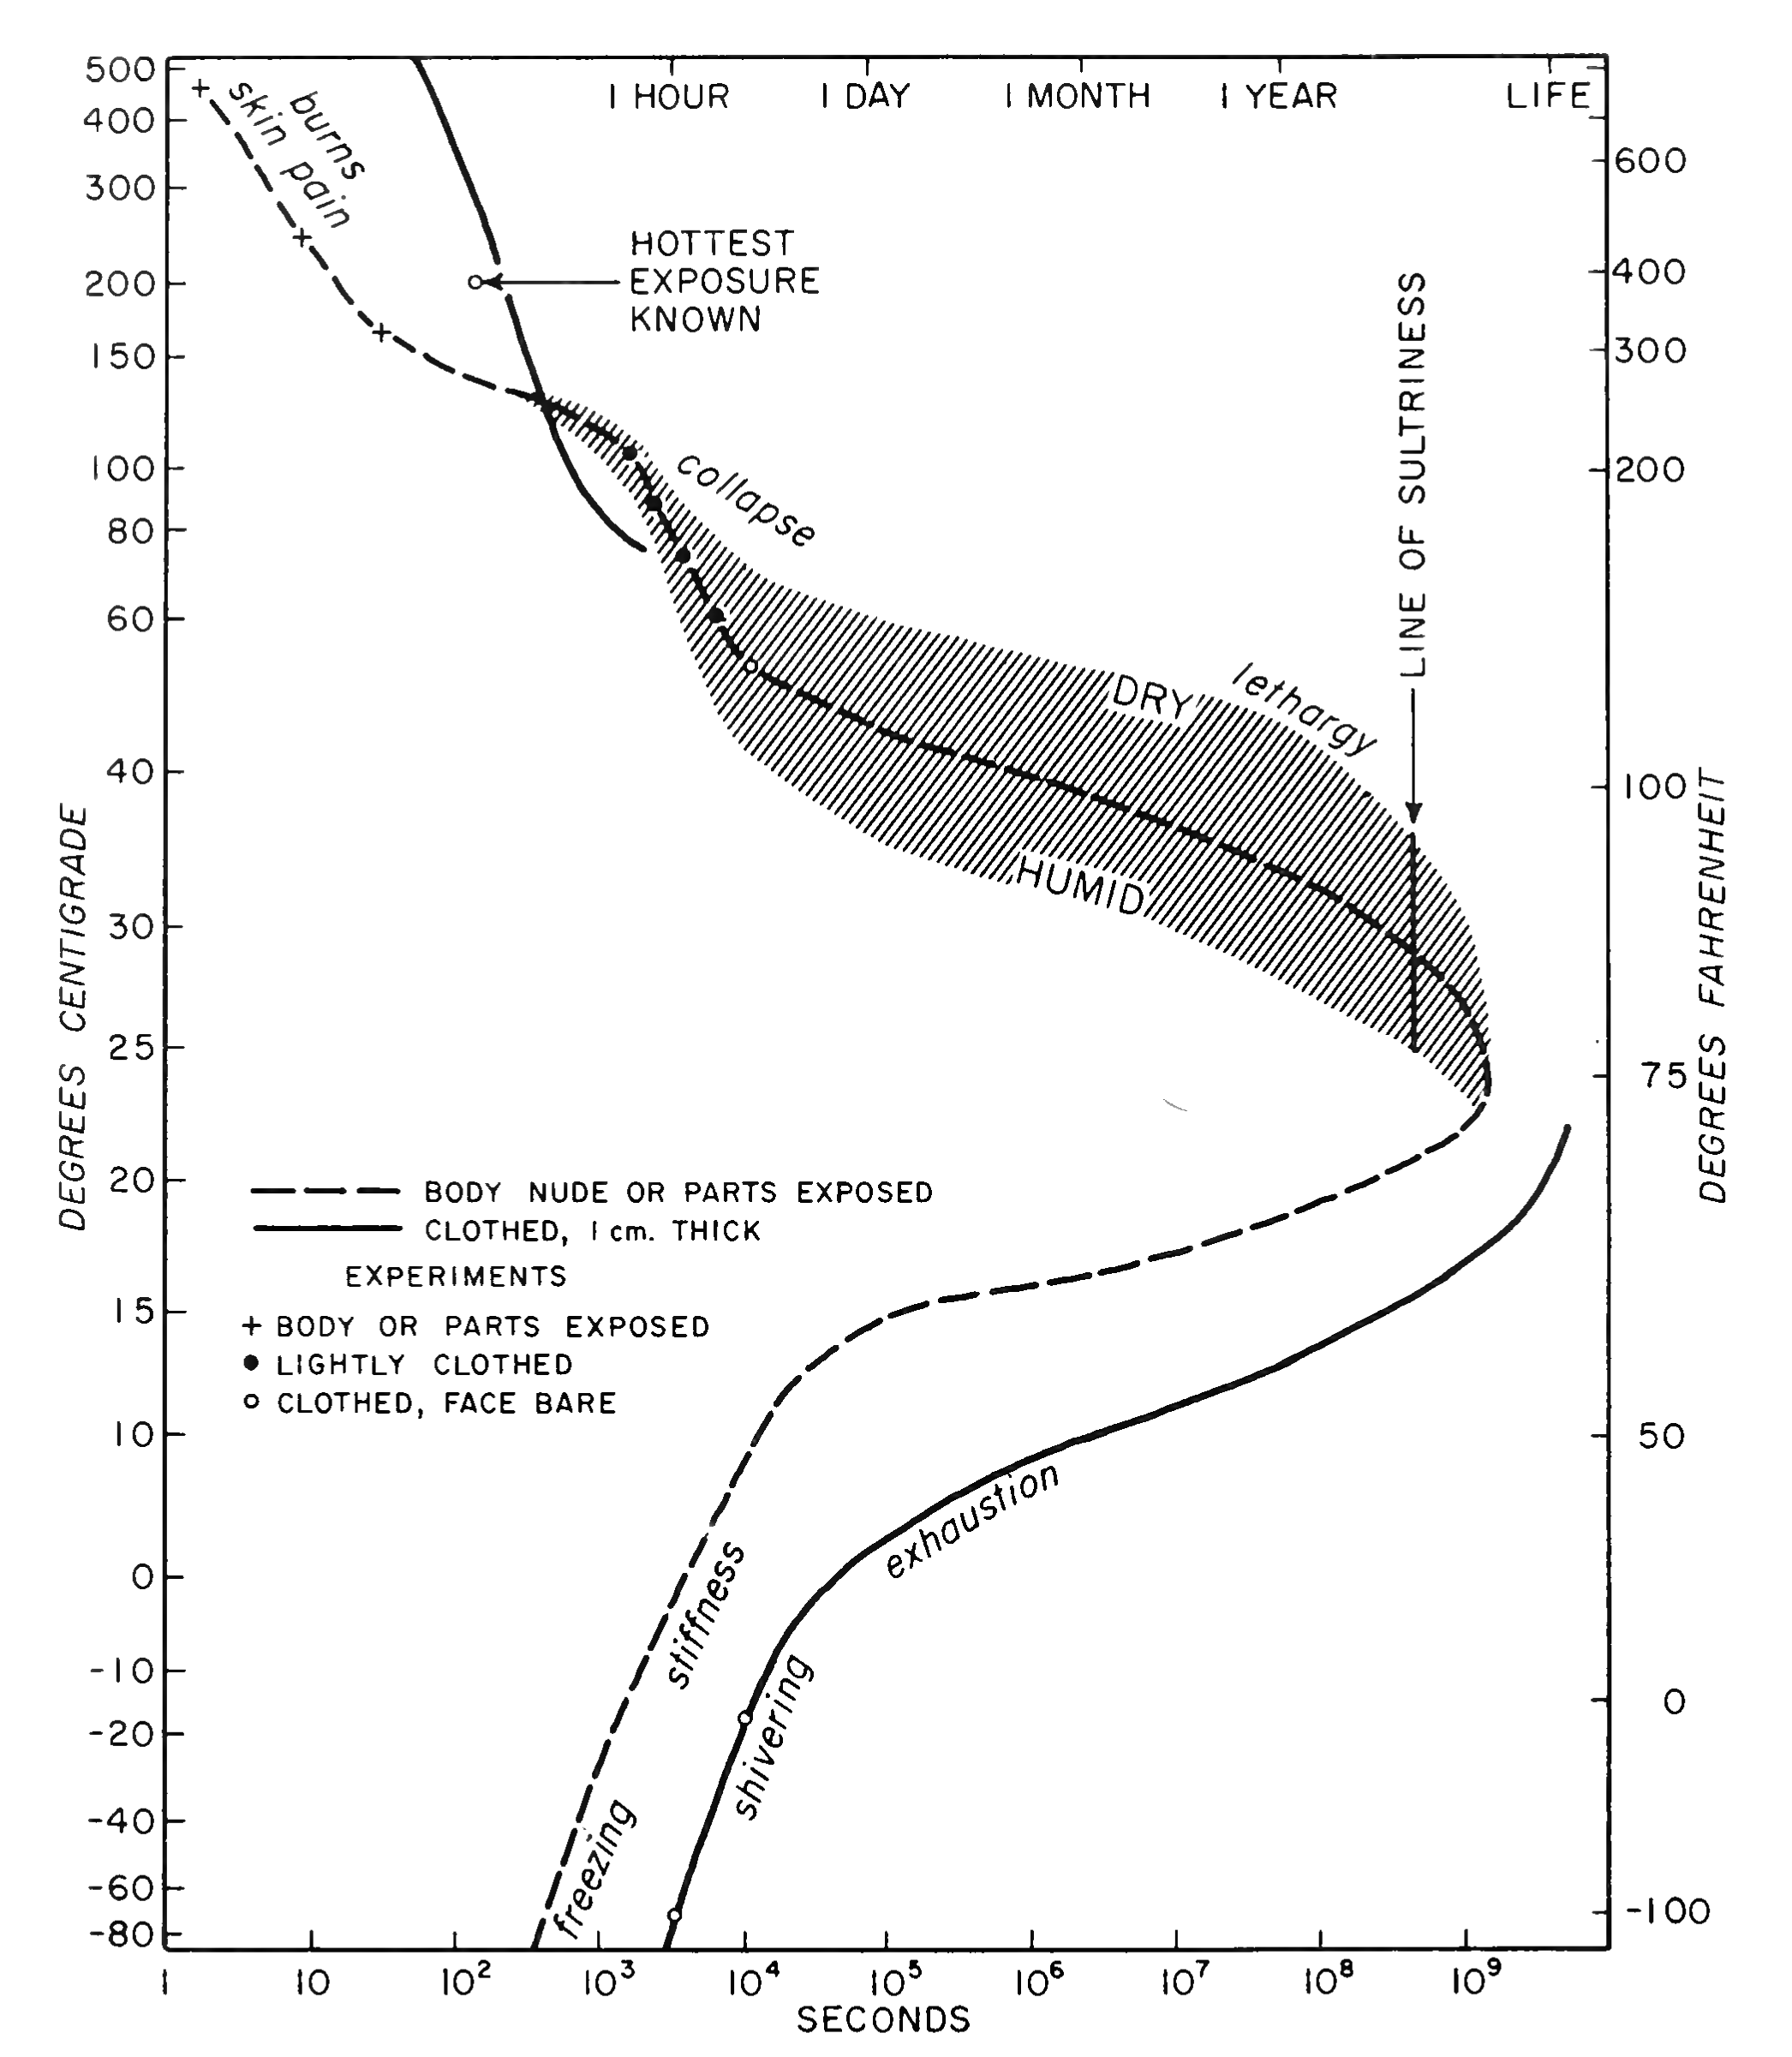
Figure 53 .--Safe exposure time for man in extreme thermal
environment
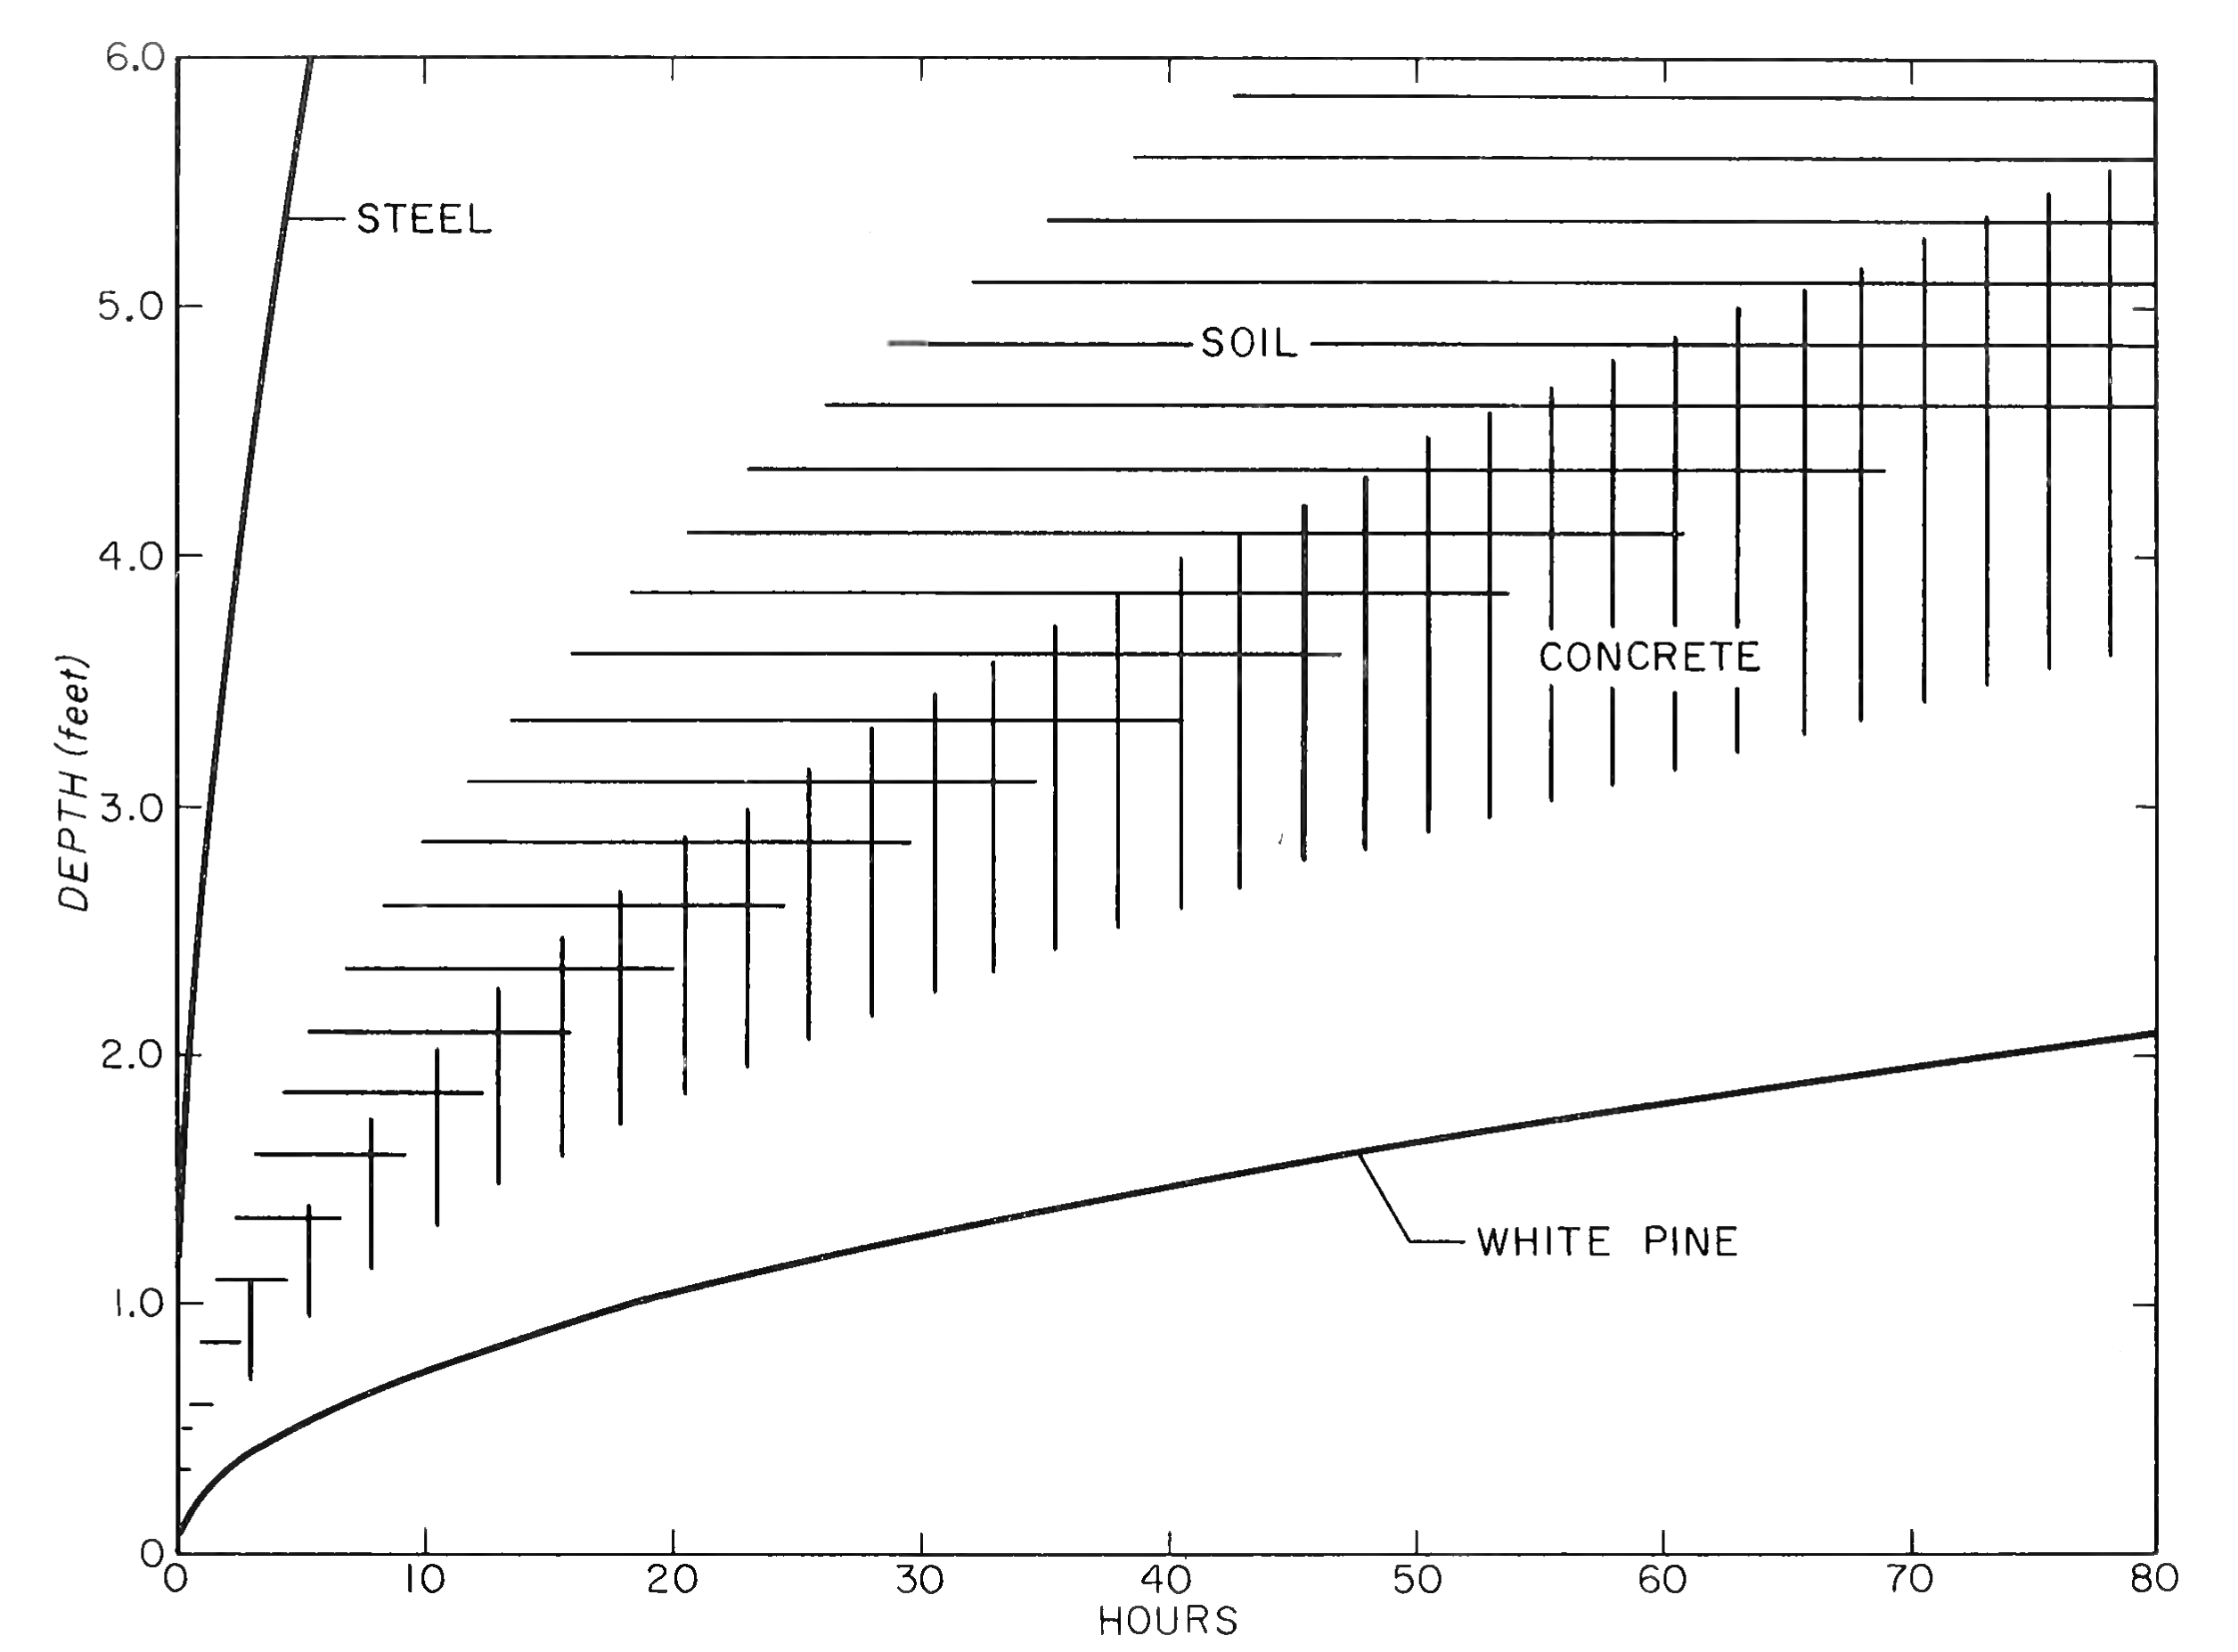
Figure 54. – Time for the temperature at a given depth
within a semi-infinite solid, originally at 60F, to reach 90F if the
temperature on the surface is maintained at 2000F.