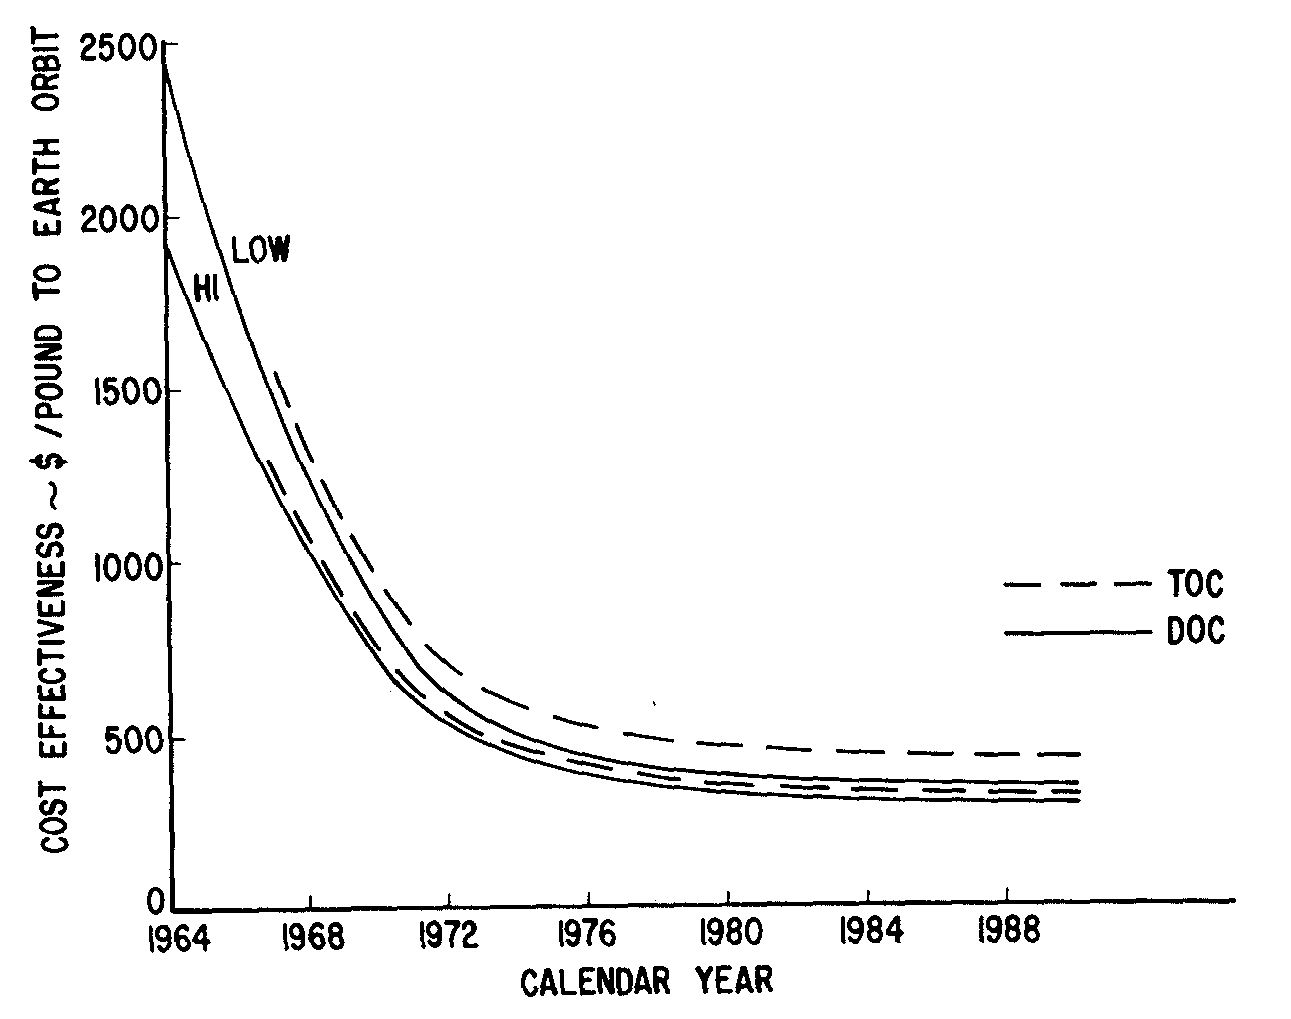
FIGURE 1. CARGO COST EFFECTIVENESS (PROGRAM A)
H. H. Koelle
Director, Future Projects
Office
Research and Development Operations
George C. Marshall
Space Flight Center
National Aeronautics and Space
Administration
Huntsville, Alabama
and
R. G. Voss
Chief, Program Analysis and Control
Group
Future Projects Office
Research and Development
Operations
George C. Marshall Space Flight Center
National
Aeronautics and Space Administration
Huntsville, Alabama
The space posture of this country is greatly influenced by the efficiency of the launch vehicles available to conduct the national space program. A large number of different types of launch vehicles, with orbital payload capabilities between 200 and 20,000 pounds per flight, are presently available for missions of interest. Others are under development and will offer a payload capability of up to 250, 000 pounds in low Earth orbits within a few years. This is the decade of a rapidly growing single flight payload capability. This concentration on performance at an early time resulted in a relatively poor cost effectiveness. The next decades will probably see a concentration on improving the economy of space transportation, since the resources are limited in contrast to the very large number of possible space missions which could be undertaken.
First, we would like to establish in this paper a general trend in Earth-to-orbit transportation economies based on the available and approved launch vehicles of the national booster program, Then, using this as a basis, we would like to study the effectiveness of the introduction of new launch vehicles in the decades to come. We want to make a rough estimate of just how much improvement can be expected by advancing the state of the art. Only chemical propulsion systems will be considered because there is little evidence, at this time, that nuclear propulsion systems will become economically competitive in the foreseeable future in the area of Earth-to-orbit transportation.
The assistance of Mr. Robert J , Davies, Future Projects Office, MSFC, in performing part of the calculations represented in this paper is greatly appreciated by the authors.
In a study of this general nature, a set of assumptions is required and must be understood for proper interpretation of the results. The assumptions are:
1. The time period under consideration will be from 1964 through 1990.
2. The 1964 value of the dollar will be used for cost calculations.
3. The residual research and development cost at the beginning of 1964 will be prorated over all flights scheduled in the total time period, when calculating total operating cost.
4, Lower and upper limits for vehicle launch rates, as summarized in Table I, are assumed.
5. Cost and reliability assumptions are listed in Table II.
6. Nominal payload capabilities assumed are listed in Table III.
7. Two separate calculations will be performed: one, designated "A, " will include only approved launch vehicles; and the other, designated ”B, " will include three new launch vehicles in addition to the existing program. These hypothetical launch vehicles have the following features:
a. Reusable Orbital Transport for Personnel (ROT) - This is assumed to be a two-stage HTO rocket plane in the one million pound take-off weight class to become operational in the mid-1970's . It can carry a crew of 2, plus 10 passengers and 6,600 pounds of cargo. In the case of cargo only transport (i.e., no passengers), the maximum cargo weight is 8,500 pounds.
b. Large Partially Reusable Cargo Transport (Post-SATURN) - This is assumed to be a two-stage VTO rocket vehicle in the 20 million pound take-off weight class with a recoverable first stage. The payload capability is 1,200,000 pounds. The number of reuses at the beginning is 2 and increases to 10 reuses at flight number 100 (straight line on log-log paper). The vehicle is introduced into the program in the late 1970's.
c . Multi-purpose Aerospace Transport (MAT) - This is assumed to be a two-stage HTO rocket plane in the five million pound take-off weight class, which becomes available in the mid-1980's. This vehicle can carry 100 passengers, plus 10,000 pounds of cargo, over a 10,000 nautical mile global range or 50 passengers, plus 5,000 pounds of cargo, into a low orbit. If used for orbital cargo delivery only, it can carry up to 20,000 pounds of cargo.
8. A new spacecraft is assumed to be introduced in 1971 for passenger transportation in connection with the SATURN IB launch vehicle, This spacecraft is assumed to be an enlarged APOLLO capsule which can transport 12 people. The development costs of this spacecraft are assumed to be $750 million and are prorated over all scheduled flights.
TABLE I: ASSUMED LAUNCH RATE (LOW/HIGH) |
||||||
|
LAUNCH VEHICLE / YEAR |
PROGRAM A |
PROGRAM B |
||||
|
1970 |
1980 |
1990 |
1970 |
1980 |
1990 |
|
|
SCOUT |
0/12 |
0/6 |
0/6 |
0/12 |
0/6 |
0/6 |
|
THOR/TAD |
18/34 |
0/6 |
0/6 |
18/34 |
0/6 |
0/6 |
|
ATLAS-AGENA |
8/24 |
0/12 |
0/12 |
8/24 |
0/0 |
0/0 |
|
ATLAS-CENTAUR |
4/12 |
0/6 |
0/6 |
4/12 |
0/6 |
0/6 |
|
TITAN II |
0/0 |
0/0 |
0/0 |
0/0 |
0/0 |
0/0 |
|
TITAN III B |
0/12 |
0/24 |
0/24 |
0/12 |
0/12 |
0/12 |
|
TITAN III C |
6/18 |
6/18 |
6/18 |
6/18 |
6/12 |
6/12 |
|
SATURN IB |
2/6 |
6/12 |
6/12 |
2/6 |
0/0 |
0/0 |
|
SATURN V |
3/9 |
12/36 |
12/36 |
3/9 |
12/24 |
6/12 |
|
ROT |
— |
— |
— |
0/0 |
50/200 |
50/200 |
|
POST - SATURN |
— |
— |
— |
0/0 |
6/18 |
6/ [cut off] |
|
MAT |
— |
— |
— |
0/0 |
0/0 |
100/200 |
TABLE II COST & RELIABILITY ASSUMPTIONS (COST IN MILLION DOLLARS) |
||||||
|
STAGE OR VEHICLE |
FIRST UNIT COST |
LEARNING CURVE (%) |
SYSTEM INTEGRATION COST |
LAUNCH COST |
REMAINING R&D & C OF F IN FY 1965 |
FIRST UNIT RELIABILITY IN CY 1964 |
|
SCOUT (1) |
1.0 |
100 |
0.1 |
0.2 |
– |
0.670 |
|
THOR |
1.5 |
100 |
– |
– |
– |
0.820 |
|
DELTA |
0.5 |
100 |
0.5 |
0.5 |
– |
0.860 |
|
ATLAS |
2.5 |
100 |
– |
– |
– |
0.800 |
|
AGENA |
4.5 |
100 |
1.5 |
1.0 |
– |
0.850 |
|
CENTAUR |
10.0 |
90 |
2.3 |
1.2 |
320 |
0.750 |
|
TITAN II (1) |
5.0 |
90 |
2.3 |
1.2 |
– |
0.800 |
|
TITAN IIIB (1) |
10.0 |
90 |
2.0 |
1.3 |
250 |
0.800 |
|
TITAN IIIC (1) |
23.1 |
90 |
2.0 |
1.5 |
800 |
0.750 |
|
S-IB |
14.1 |
90 |
– |
– |
– |
0.750 |
|
S-IVB (2) |
19.4 |
90 |
6.0 (3) |
3.7 (3) |
1000 (6) |
0.705 (2) |
|
S-IC |
41.0 |
90 |
– |
– |
– |
0.750 |
|
S-II |
27.0 |
90 |
11.0 (4) |
6.2 (4) |
4300 (7) |
0.800 |
|
N-I |
132.0 |
90 |
15.5 (5) |
– |
– |
0.670 |
|
N-II |
39.7 (2) |
90 |
21.0 |
10.0 |
9672 |
0.750 |
|
ROT (1) |
2.7 |
95 |
– |
– |
5302 |
0.950 |
|
NOTES: 1) COMPLETE VEHICLE 2) CONTAINS I.U. 3) IB ONLY 4) V ONLY 5) FOR REUSE OF N-1 (NO FUNDS PRIOR TO FY65) 6) INCLUDES SHARE OF S-IVB FOR SAT. V (NO FUNDS PRIOR TO FY65) 7) INCLUDES SHARE OF S IVB FOR SAT. IB (NO FUNDS PRIOR TO FY65) |
||||||
TABLE III. NOMINAL ORBITAL RAYLOAD CAPABILITIES |
|
|
VEHICLE |
POUNDS |
|
SCOUT |
200 |
|
THOR-FAMILY |
1,200 |
|
ATLAS-AGENA |
5,000 |
|
ATLAS-CENTAUR (1965/66) |
8,000 |
|
ATLAS-CENTAUR (1967/70) |
10,000 |
|
TITAN II |
7,000 |
|
TITAN III B |
5,000 |
|
TITAN III C |
28,000 |
|
SATURN I B (1964/65) |
20,000 |
|
SATURN I B (1966/69) |
30,000 |
|
SATURN I B (1970/90) |
40,000 |
|
SATURN V (1967/68) |
240,000 |
|
SATURN V (1969/90) |
300,000 |
|
ROT |
8,500 |
|
POST-SATURN |
1,200,000 |
|
MAT |
20,000 |
The results of our calculations are summarized in Figures 1 through 9. These illustrations are discussed below.
Figure 1 is the expected cost effectiveness of the presently approved launch vehicle program if extrapolated versus time. Two different firing rates (as given in Table I) are shown in order to establish a probable lower and upper limit. Included as direct operating costs (DOC) are the vehicle hardware, propellants, payload integration, and launch costs. In case of reuse the refurbishment costs are also included. Total operating costs (TOC) include the direct operating costs plus prorated vehicle development and facility costs. The cost trend shown in Figure 1 shows somewhat higher values than predicted until now. The reason for this is the inclusion of the maintenance and operations cost of the Michoud Manufacturing Plant, the Mississippi Test Facility, and the Merritt Island Launch Area.
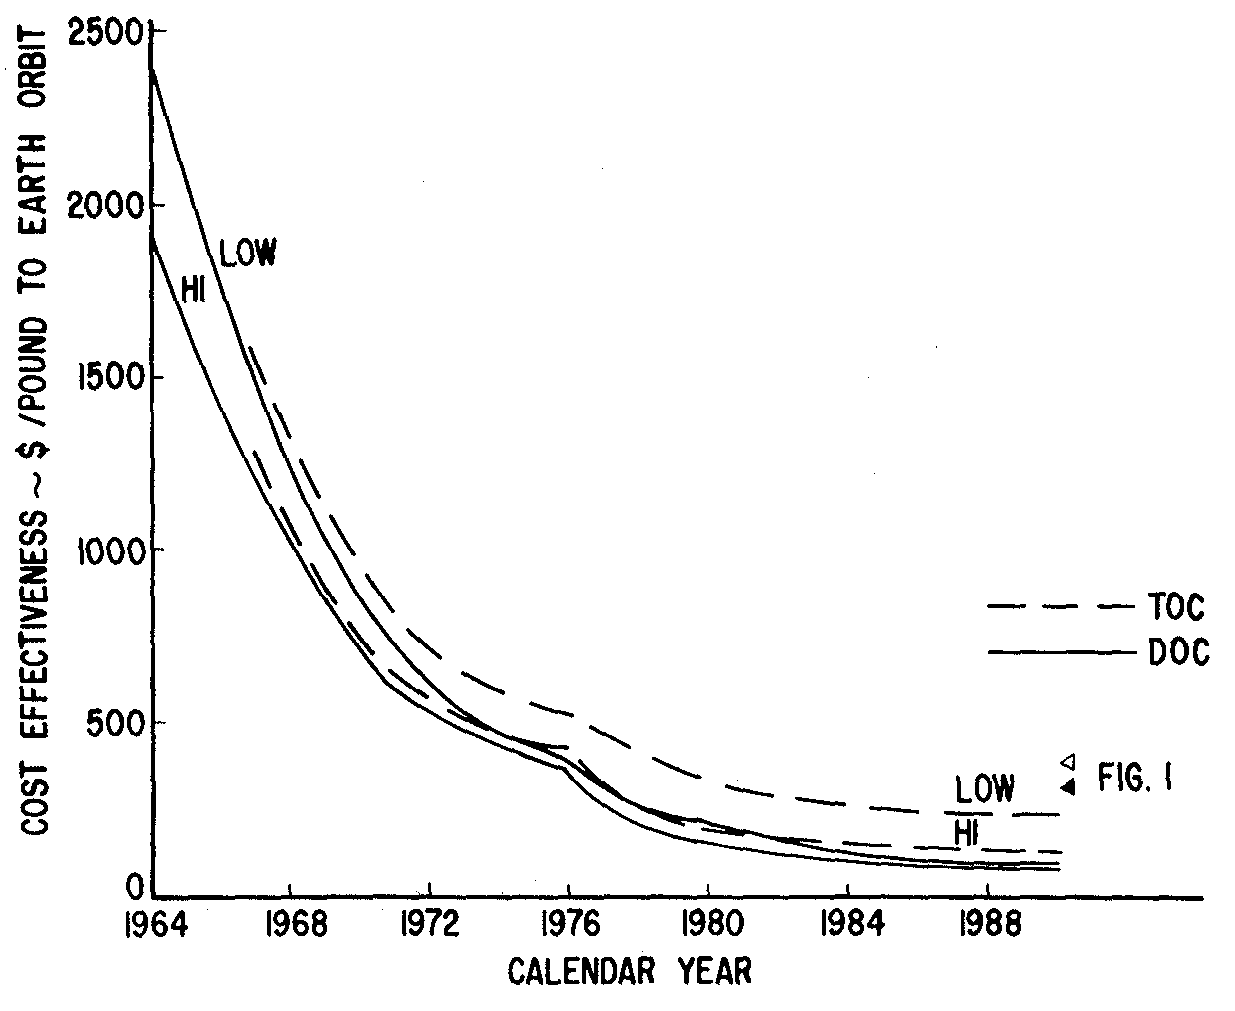
Figure 2 shows the influence of the three new launch vehicles described in Section II. A marked drop of the cost effectiveness can be expected for the later 1970's when the ROT and the Post-SATURN enter the Earth-to-orbit cargo transportation picture. The two triangles shown for 1990 are the respective values of Figure 1 and indicate the middle of the band. Thus, an improvement by more than a factor of three can be expected if use is made of the advanced state of the art to become available during the 1970's.
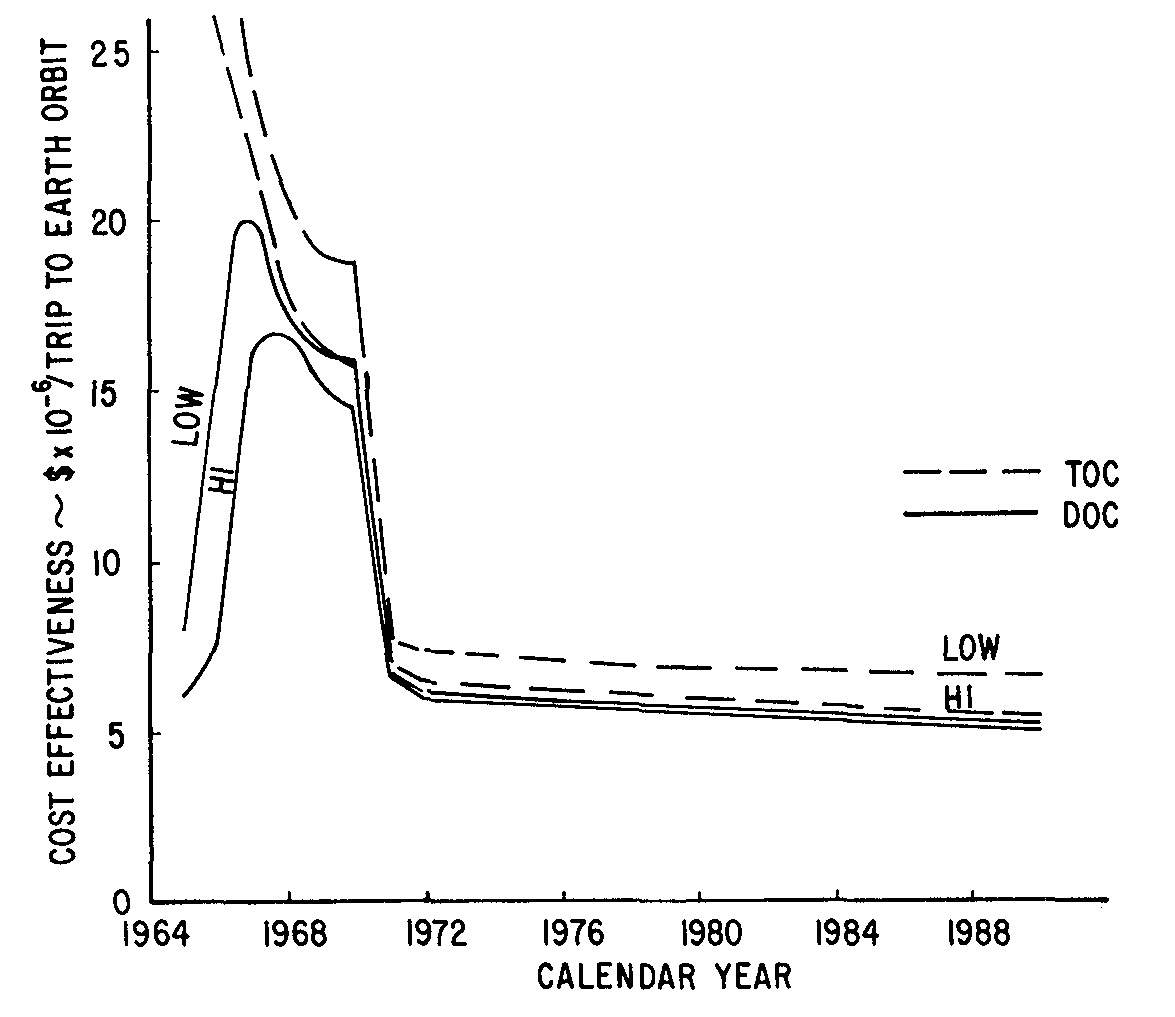
Figure 3 shows a somewhat different trend for the transportation of personnel to and from orbit. First we see a rise of the passenger transportation cost during the late 1960's, which results from the fact that quite a few flights are expected in this time period using APOLLO hardware. The APOLLO spacecraft is designed for lunar flight, and is relatively inefficient for Earth-to-orbit transportation. If an enlarged APOLLO type capsule (12 men) is used in connection with the SATURN IB launch vehicle, the trend shows a marked improvement as indicated for 1971. However, all launch vehicles and spacecraft used in the calculations represented by this chart are of the expendable type, and it can be readily seen that these will drop the passenger transportation cost not much below $5 million per man per trip: a value far too high for extended space flight operation.
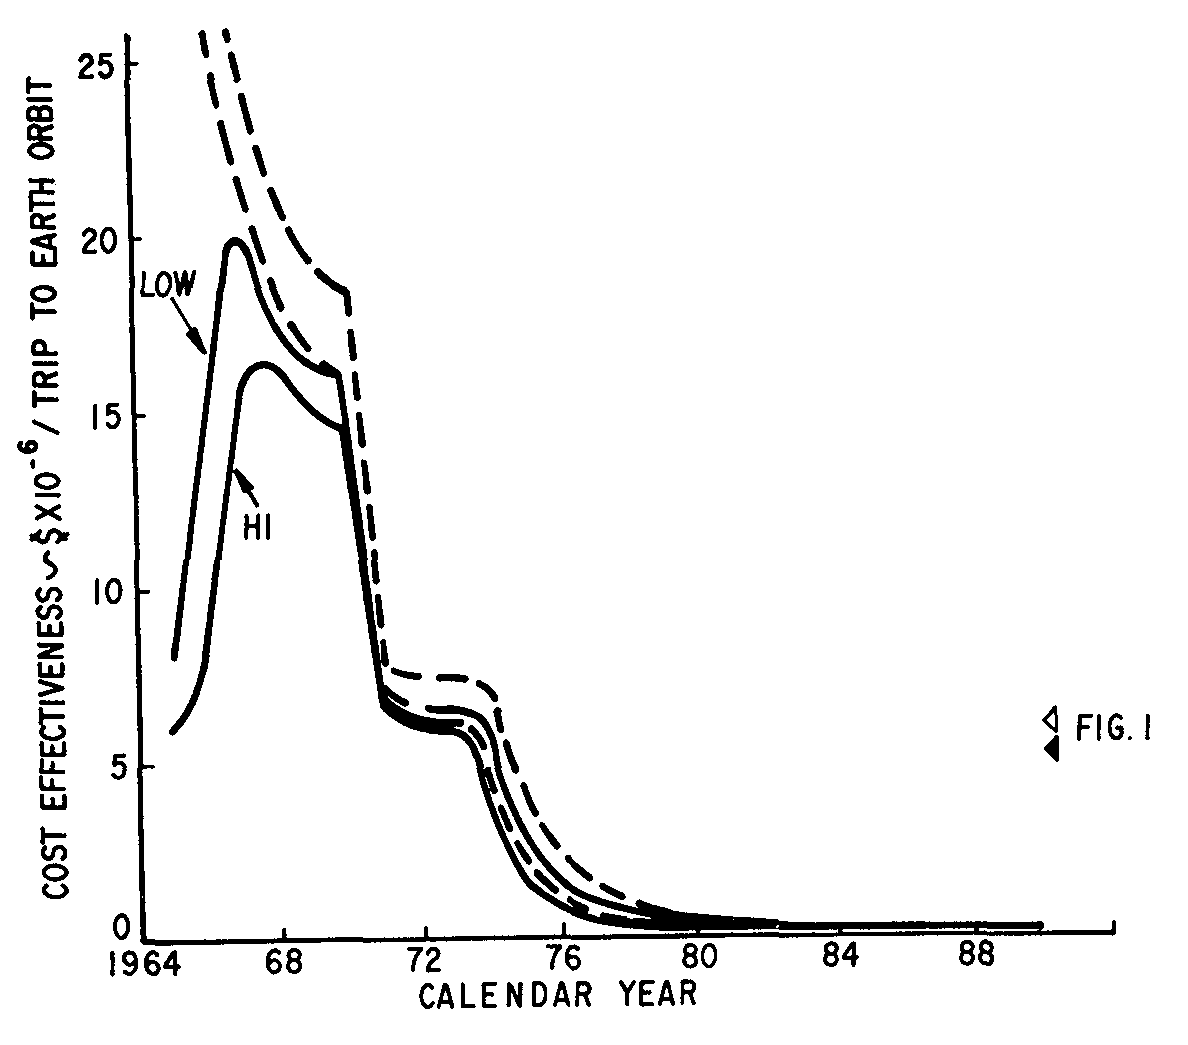
Figure 4 illustrates the drastic reduction of personnel transportation cost which could be obtained by a fully reusable orbital passenger transport in the mid-1970's. The cost per man per trip could drop to less than $100,000. This is a reduction by a factor of 50 . Note the triangles in 1990 which give the location of the trend curves for expendable transport systems, A further reduction is possible (which is not apparent on this illustration) if and when a multi-purpose aerospace transport (MAT) can be successfully introduced into the commercial global transport market and can also serve the space market as well. In this case, a price of less than $10,000 per man per trip is foreseen for Earth to orbit transportation in the late 1980's.
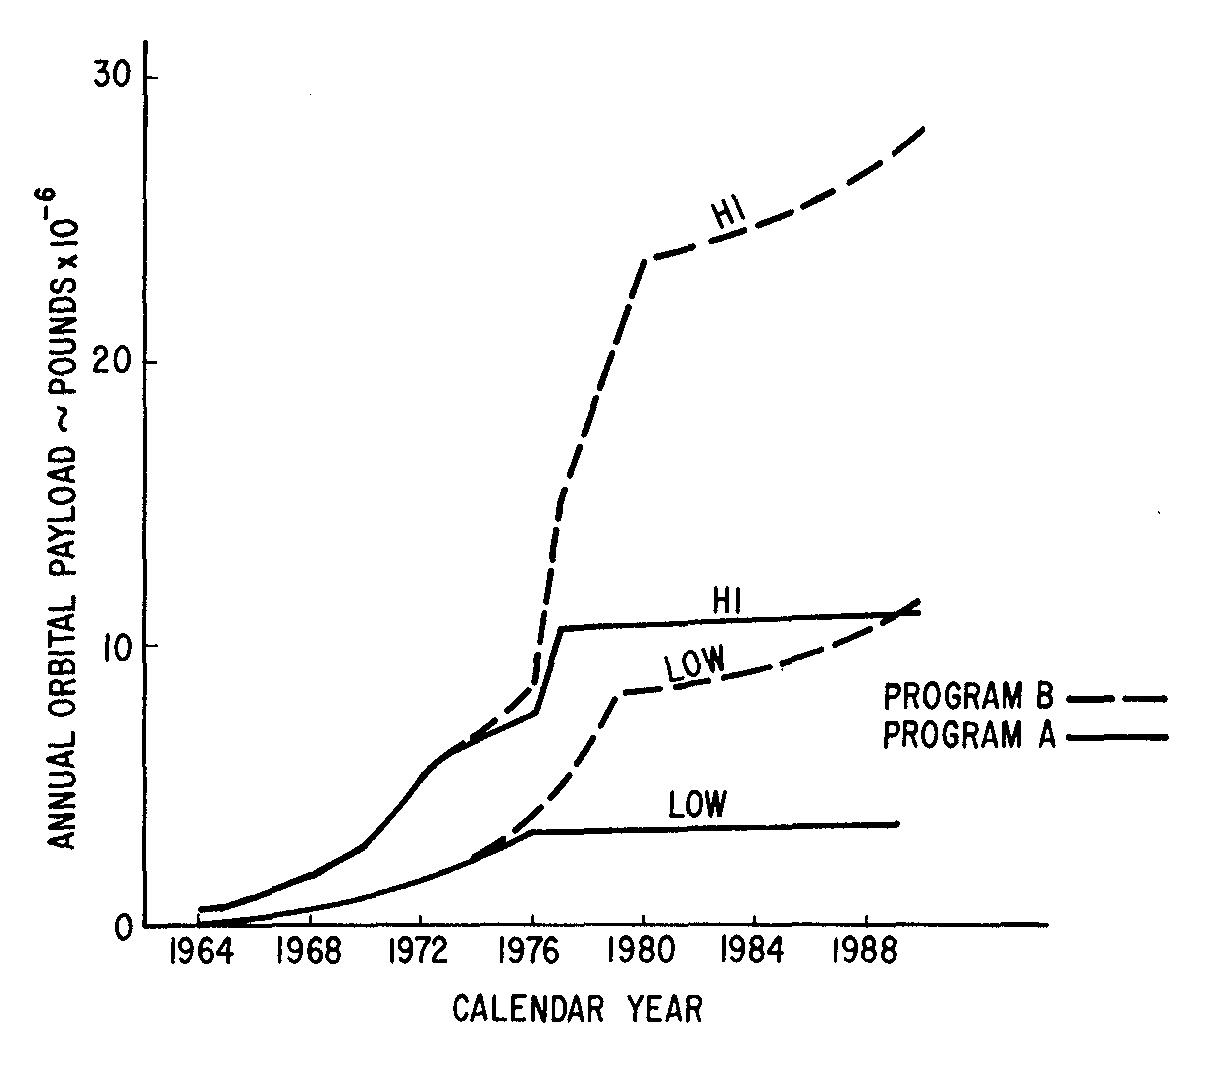
Figure 5 is a plot of the annual orbital payload capability versus time resulting from the assumptions made in this study. It is interesting to note that the national space transportation capacity will be two and one-half times higher if new launch vehicles are introduced (Program B) at a total cost not much more than, the alternate program (Program A, no new launch vehicles) if integrated over the total time period under consideration. From this viewpoint, the development of new launch vehicles in the 1970's appears to be a worthwhile investment.
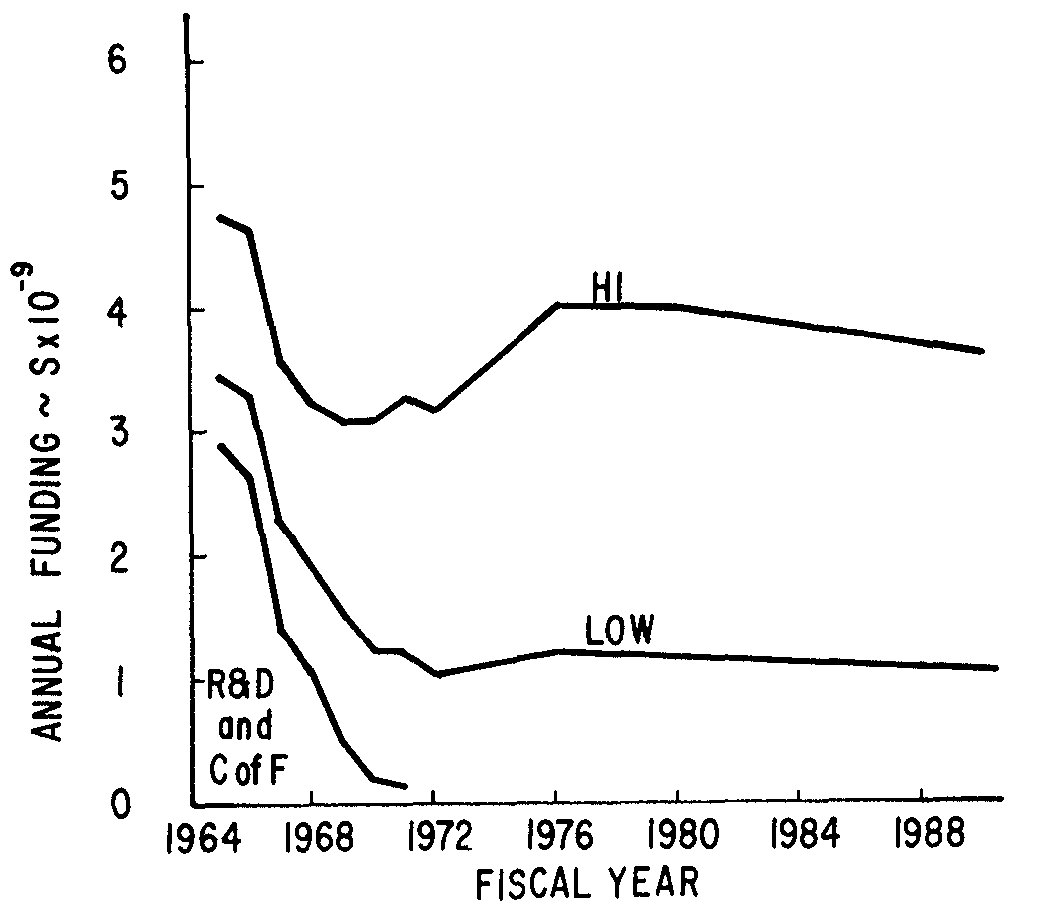
Figure 6 is a plot of all resources required for the development, procurement, and operation of the national booster program for the assumed launch rates of Program A. This does not include the NASA operational budget nor the cost of most of the spacecraft. The low launch rate assumed for Program A seems to be a very modest program, based on today's standards with respect to the acceptable share of the space program if put in proportion to the gross national product (GNP).
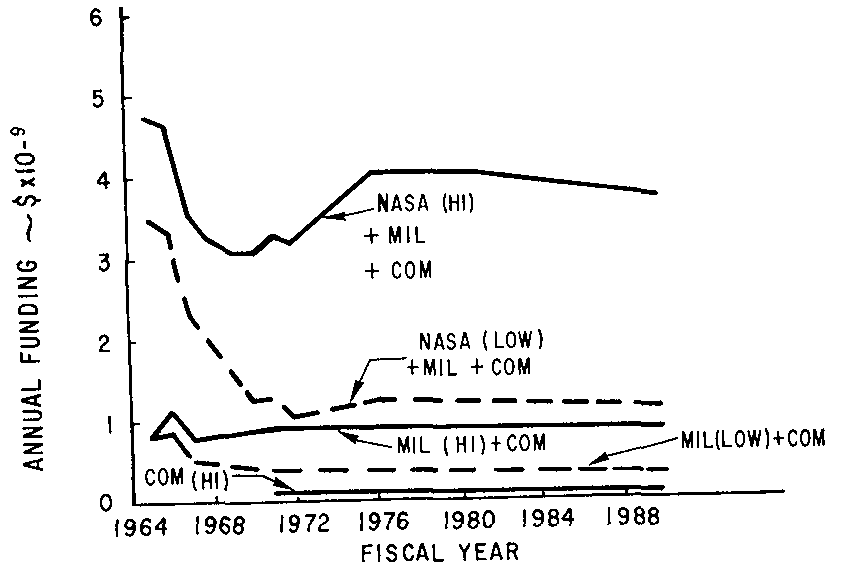
Figure 7 shows the same resources requirements as Figure 6, but the total is now broken down according to the sources for this funding or "customers." "With this set of assumptions, NASA would finance about three-fourths of the total program with only a very small contribution from commercial sources.
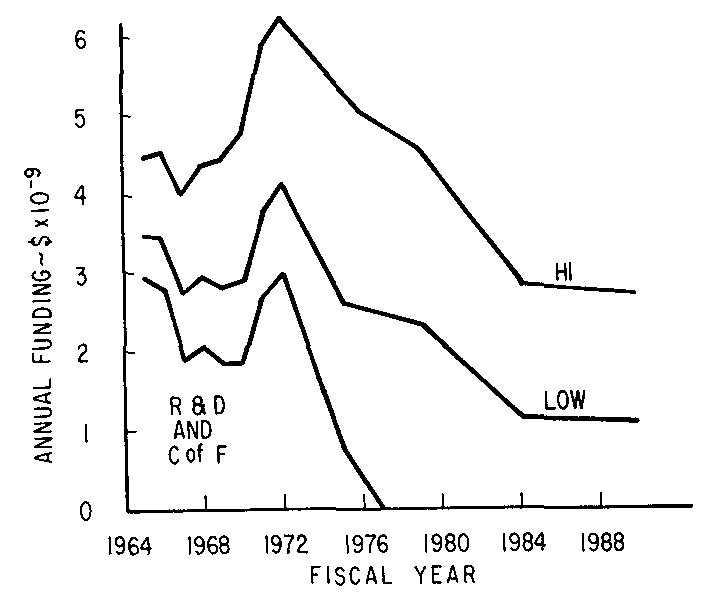
Figure 8 shows the required resources for Program B as a function of time. We now see that a problem exists in the early 1970's, where the peak funding rate rises to $6 billion. This results from the assumption of a relatively heavy operational space program plus the almost overlapping development of two new launch vehicles. One way of alleviating this situation is to go back to the lower launch rate in the operational program temporarily, and start one of the two launch vehicle development programs as early as possible and delay the other by one or two years to obtain a better spread.
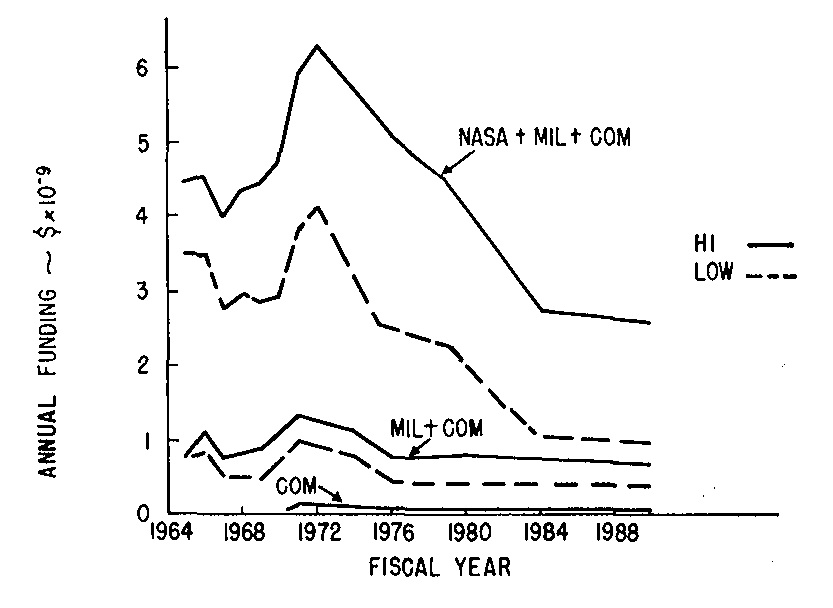
Figure 9 shows the distribution of the required resources over the expected markets: NASA, military, and commercial. The total market then amounts to an average expenditure of about $3.5 billion per year on the basis of a nominal program which is in the middle of the two launch rates given. By subtracting the other markets, this would result in an annual average budget of approximately $2.6 billion for NASA. Assuming that the development, procurement, and operation of launch vehicles amounts to approximately one-third of the total NASA budget, this program would result in an expenditure rate of approximately $7.6 billion per year during the next 20 years, which is perhaps not unreasonable if we consider 4 percent growth per year of the GNP. Over the time period considered, the GNP will average close to $1,000 billion per year, thus, the program sketched above would represent about three-fourths of the one percent of the GNP. The NASA budget in FY 1965 is expected to be close to $5.2 billion and the GNP $620 billion; thus, the NASA budget will be approximately 0.84 percent of the GNP.
This short study permits the following tentative conclusions:
1. The cost effectiveness for cargo delivery to Earth orbit should drop by an order of magnitude during the next 10 years, but without the introduction of new, greatly improved launch vehicles, the cost effectiveness for Earth-to-orbit transportation will probably not fall below $300 per pound.
2 . Without the introduction of reusable orbital transports, the Earth-to-orbit round-trip cost per man is not expected to drop below $5 million.
3. Earth-to-orbit passenger transportation cost can be reduced to about $100, 000 per man per trip in the late 1970's and to about $10, 000 per man per trip in the late 1980’s (under favorable circumstances) by introducing new fully reusable orbital transports .
4. The cost effectiveness of the national booster program can be improved by about a factor of three in the 1980's by the introduction of a large fully reusable, or partially reusable, launch vehicle in the one million pound payload class.
5. While it appears desirable to develop two new launch vehicles over the next 15 years, a peak requirement may result with respect to resources in the early 1970's, unless these 2 developments are properly phased.
6. It appears reasonable to assume that an annual orbital delivery capability of 10 million pounds should be available in the late 1970's, and possibly triple a decade later.
7. Further detailed studies are required to confirm the described trends and to develop specifications for new launch vehicles, which could strengthen the national booster program considerably.